Transportation Energy Consumption in the US
Introduction
In this post, I am going to briefly talk about how the transportation energy consumption varies across United States. Much of the energy in that sector is from liquid fuels and the transmission and distribution network of these fuels have enormous land use and transportation implications. If we were to think about changing the fuel mix of the transportation fleet (say for example making hydrogen fuel cells or electricity more prominent), we need to think through its implications.
This work is published as Kaza, N. 2020 Urban Form and Transportation Energy Consumption, Energy Policy
In the United States (US), the transportation sector consumes about 29% of the total energy in 2017, rising from 23.5% in the 1960s even while the energy efficiency of the economy increased. Much of this energy comes from liquid carbon-based fuels contributing to greenhouse gas emissions and bad air quality. While we know a bit about how much energy is consumed in the transportation sector nationally, we don’t really have a grasp on how various local and state policies (incluidng the design, form and function of cities and regions) are affecting transportation energy consumption.
Three components of energy consumption
The three main components that explain energy consumption in the sector is the total volume of travel, mode split and average energy efficiencies of the fleet mix. Volume of travel depends on the distances between origins and destinations, network effects and trip frequencies. Mode split, the transportation mode that trip uses, is dependent on distances that need to be travelled, the availaibility and ease of mode not just for the particular trip, but for subsequent and prior chained trips and trip purposes (e.g. delivery of goods, shuttling kids). The energy efficiency of the fleet mix depends on adoption rates of newer vehicles, organisational/household acquisition rules and procedures and government policies on pollution control mechanisms, tax subsidies, depreciation rules etc.
In addition to these complicated mechanisms through which we can influence energy consumption, we should also be mindful of the different components of energy consumption. We need to account for transportation consumption both in freight and in person travel. Light duty vehicles with short wheel bases (passenger cars, vans, SUVs etc.) only accounted for 52% of highway transportation energy in 2016 (Bureau of Transportation Statistics 2018 Table 4.06). Assuming other vehicle types are largely associated with non-household travel, relying simply on household travel underestimates the total energy consumption in the system and the impact of urban form.
Sales in Gas stations
Sub national information is not easily forthcoming for transportation sector. Since we can not simply proxy total energy consumption from VMT derived from household travel surveys, we need an alternative strategy. Because most of energy is purchased at retail gas stations in the US, we can study the geographic differences in energy consumption, by studying the variation in gas station sales.
I use the 2012 Economic Census by the US Census Bureau to construct a proxy for transportation energy consumption, by analyzing the sales at gas stations in each county (or equivalent areas) of the United States. The Bureau collects extensive data on businesses every 5 years. I use the data is reported at a county level for the retail sector (North American Industrial Classification System (NAICS) code 44-45), in particular, the total sales receipts from the gas stations (NAICS 447). Due to confidentiality concerns, data for 344 counties are not reported.
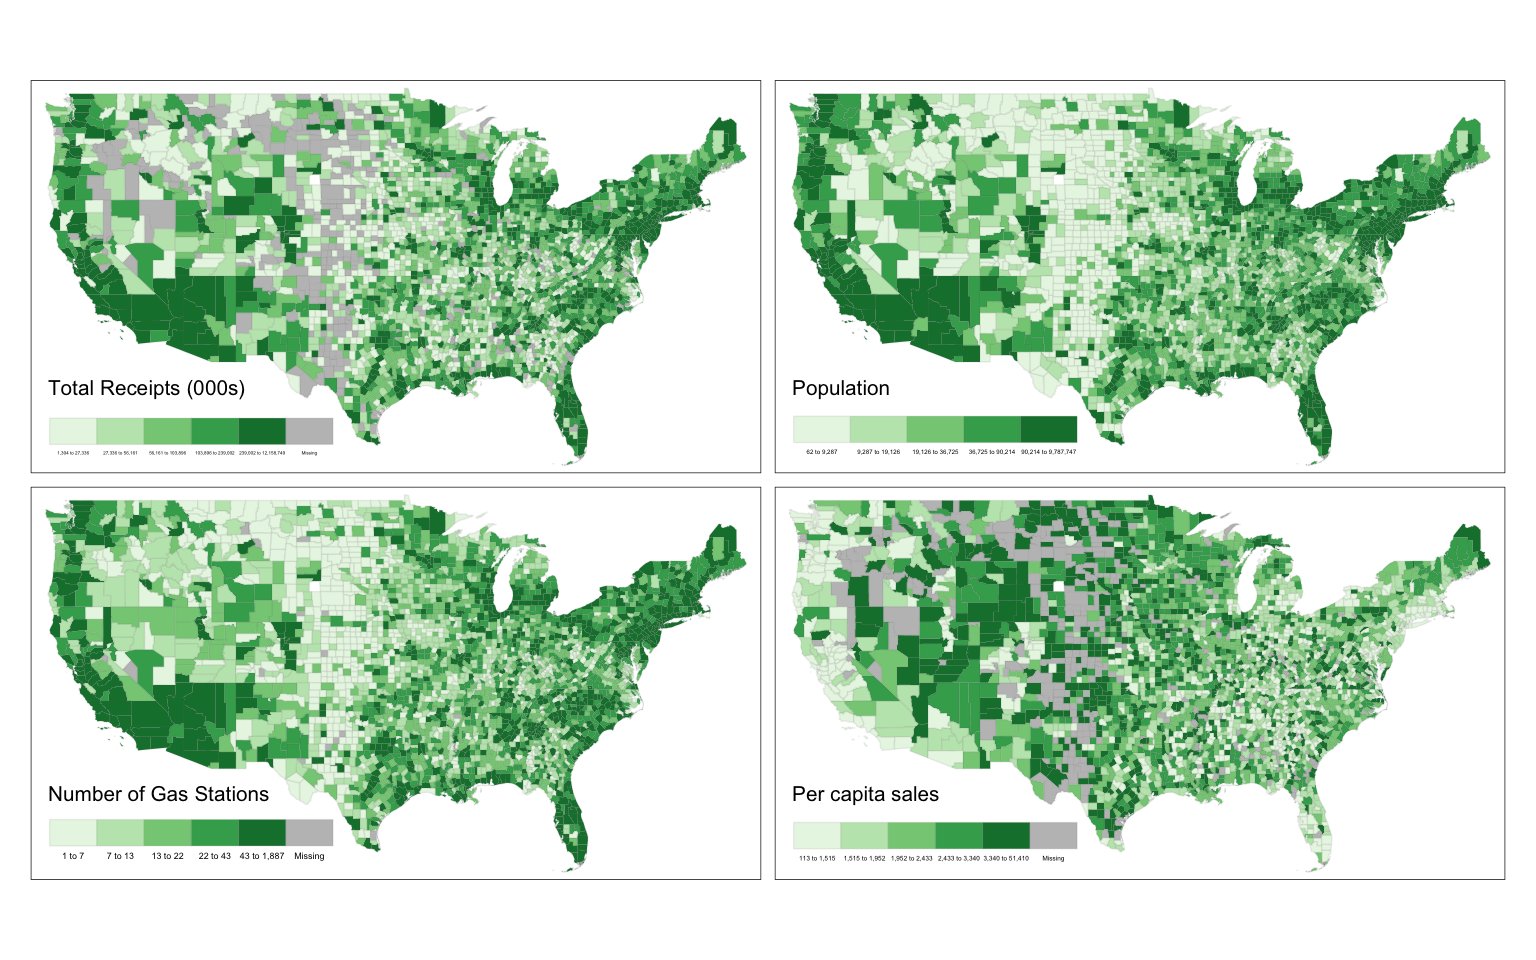
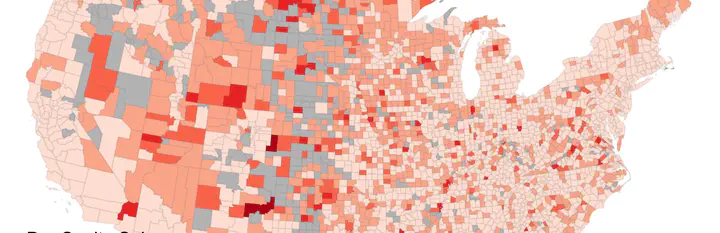
From the above map, it should be clear that there are some outliers (e.g. Culberson County, TX for per capita consumption) that might skew our understanding. It is also entirely possible that there might be data quality issues associated with those outliers.
Energy Consumption by County Character
Of all the states, Wyoming and North Dakota are among the top of the per capita expenditure in gasoline stations, followed by the states in the Midwest. These states are characterized by low population and vast open spaces. The populous regions in the US, the Northeast and the Pacific are at the bottom of the per capita expenditures. District of Columbia has only $418 expenditures per capita suggesting potential explanations of large commuting population from nearby states (Virginia and Maryland in particular), extensive public transportation infrastructure and high population density.
Counties outside metropolitan statistical areas have 41.2% more per capita sales than those within them. While these counties account for only 16.2% of the total population, this suggests that urbanization is associated with lower per capita consumption due to proximity of destinations and increased economic development. Finer urban type classification of the counties from National Center for Health Statistics (NCHS) reveal an even starker pattern. Large central metro counties, on average, have two fifths of the per capita sales of the non-core rural counties. As the urbanization intensifies, per capita consumption decreases (see Table below), even though large and medium metro counties account for more than two-thirds of the total sales.
| County Type | Annual Sales (Millions) | Per capita Sales |
|---|---|---|
| Non-core | 47.3 | $3,725 |
| Micropolitan | 110.1 | $2,622 |
| Small Metro | 190.1 | $2,400 |
| Medium Metro | 333.8 | $1,975 |
| Large Fringe Metro | 363.7 | $1,775 |
| Large Central Metro | 1,753.2 | $1,285 |
Of the metropolitan areas Cheyenne, WY, Winchester, VA and Joplin, MO spend more than 4,000 USD per capita in gas stations, suggesting a large variation within urban areas. Corvallis, OR has the least, with both New York, NY and Boulder CO following closely (<1,000 USD per capita). This suggests dense urban environments with high transit amenities may result in lower spending. Metros along the Gulf coast and in states like Arizona and South Carolina exhibit large expenditures.
Gas stations & Convenience Stores
In the United States, most gas stations come with convenience stores. It could very well be that some of the sales at the gas stations, come from the non-fuel sales. Unfortunately, it is hard to tease out how much of it is gasoline/diesel sales and from convenience store items. It is also likely that in rural counties, the convenience store sales form larger proportion of the total sales as options may be limited.
We can test the effect of the convinence stores by looking at sales from gas stations that do not have conveniences stores and comparing them to those that do. Unfortunately due to privacy restrictions, data for 835 counties are reported in the 2012 census. For this subset of counties, the correlation between sales from all gas stations and those from gas stations without convenience stores is 0.82.

The difference between the red and black lines represent the bias in the data introduced by the convenience stores.
Conclusions
Because transportation, by definition, is highly mobile it is not clear what percentage of the sales in each county can be associated with travel within the county and what is a function of regional travel and transportation throughput. Because highly disaggregated data on sales and locations of gas stations is not readily available, we cannot tease out these effects. Future work involving digital traces of household expenditures, could perhaps be used to elucidate these effects. It is clear that gas station sales are an imperfect measure of transportation energy consumption. But it is a useful one at a subnational scale to understand the geographic variations in energy consumption.
Nikhil Kaza
Professor
My research interests include urbanization patterns, local energy policy and equity