Scraping Craigslist Posts
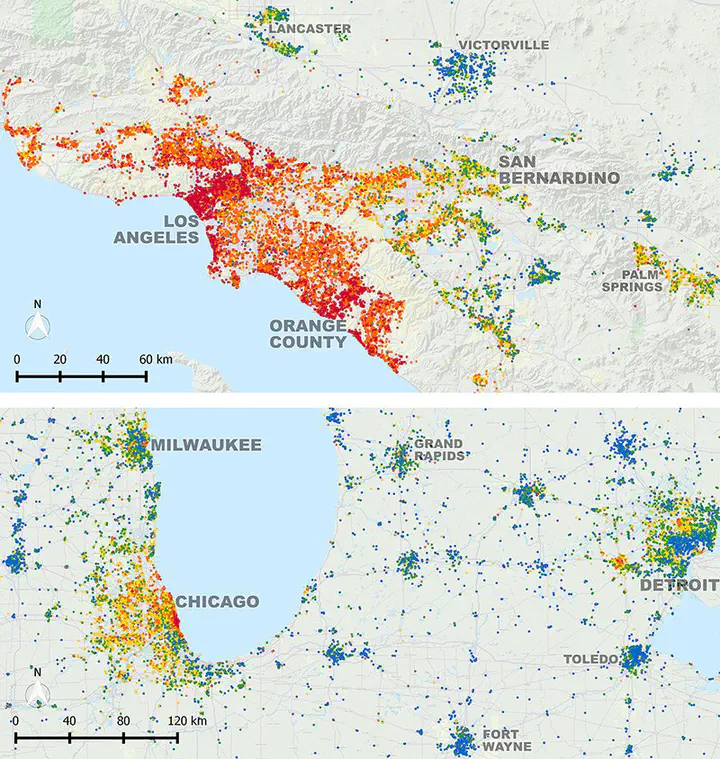 Boeing, G. and P. Waddell. 2017. “New Insights into Rental Housing Markets across the United States: Web Scraping and Analyzing Craigslist Rental Listings.” Journal of Planning Education and Research, 37 (4), 457-476. doi:10.1177/0739456X16664789
Getting Started
When the data is unstructured or seemingly unstructured, we can still use R to create some structure. In this post I am going to demonstrate how to scrape a html page to extract the relevant information and convert them into a table for further analysis. In this particular example, we want to use Craigslist. Usual disclaimers about data retrieval and storage apply. Please consult a lawyer, especially if you use the data for non-research purposes. Also you can follow along the evolving landscape of the media law on this topic.
Additional Resources
-
Munzert, Simon, Christian Rubba, Peter Meißner, and Dominic Nyhuis. 2014. Automated Data Collection with R: A Practical Guide to Web Scraping and Text Mining. 1 edition. Chichester, West Sussex, United Kingdom: Wiley.
-
Pittard, Steve. 2019. Web Scraping with R.
Understanding the structure of the query
In this post, I am going to demonstrate how to scrape and assemble the rental listings in Boston. To start, it is useful to use your browser to access the webpage.
https://boston.craigslist.org/d/apts-housing-for-rent/search/apa
The results should look like this

On the left hand corner, you will notice that there are forms that you can use limit the search results. For example,
https://boston.craigslist.org/search/apa?postedToday=1&max_price=2000&availabilityMode=0&broker_fee=1&sale_date=all+dates
refers to a search with
- “posted today” is checked
- “maximum price” is “2000 usd”
- “availability” is set to “all dates”
- “no broker fee” is checked
- “open house date” is set to “all dates”
Few things to note.
- Cities are subdomains. i.e. if you need to information about Raleigh, you need to use
https://raleigh.craigslist.org/ - The second bit of it
/d/apts-housing-for-rent/search/apais same for all cities but will change if you want to scrape something other than apartments. - The browser uses a
httpsprotocol instead of ahttpprotocol. This is more secure, but occasionally poses problems for accessing the web usingcurlinstead of a browser. cURL is a command-line tool for getting or sending data including files using URL syntax often used explicitly within scripts that are used for web scraping. We are going to uservestwhich takes care of this issue. - The arguments start after
?. - Match the options checked on the browser to the variables in the url and the values they take. For example,
postedTodayandbroker_feeare set to 1 when corresponding boxes are checked. - Variables are concatenated using
&in the url string. - It looks like the spaces in
all datesare replaced with a+. Usually they are replaced by%20a hexadecimal code for space. It is useful to understand the hex codes for special characters.
Based on the understanding of the above url, we can use conventional string manipulation to construct the url in R as follows.
library(tidyverse)
library(rvest)
library(tmap)

location <- 'boston'
bedrooms <- 2
bathrooms <- 2
min_sqft <- 900

baseurl <- paste0("https://", location, ".craigslist.org/search/apa")

# Build out the query
queries <- vector("character", 0) # Initialise a vector
queries[1] <- paste0("bedrooms=", bedrooms)
queries[2] <- paste0("bathrooms=", bathrooms)
queries[3] <- paste0("minSqft=", min_sqft)

(query_url <- paste0(baseurl,"?", paste(queries, collapse = "&")))
# [1] "https://boston.craigslist.org/search/apa?bedrooms=2&bathrooms=2&minSqft=900"
Exercise
Try out the different urls and understand how the query to the server works. i.e. try different cities, different types of ads and different arguments to the queries. It is useful to construct different urls by typing them out so that you understand the syntax.
Figuring out the structure of the results
An url request to the server usually results in an HTML page that is rendered in the browser. In other posts, we have seen how the URL may result in JSON objects which are much easier to deal with to create a structured dataset. But HTML pages are often with some structure that are used to render the page. Sometimes, we can take advantage of that structure to infer and extract what we need.
To examine the structure, we will have to use the developer tools in the web browser. In the rest of the tutorial, I am going to use Firefox as a browser, though analogous tools can be found for other browsers. You can open the Firefox Developer Tools from the menu by selecting Tools > Web Developer > Toggle Tools or use the keyboard shortcut Ctrl + Shift + I or F12 on Windows and Linux, or Cmd + Opt + I on macOS.

The most useful thing for this exercise is the page inspector, usually in the bottom left. You can right click on any post in the craigslist result page and use inspect element to understand what the structure looks like. Or alternately, you can point to various elements in the inspector and see different elements highlighted in the browser window.


In this particular instance each posted ad seems to be within a <div> with a class cl-search-result, with a data-pid associated with it.

That is our way in to scraping and structuring the data. To take advantage of the HTML elements, you need to become somewhat familiar with css selectors. You can use a fun game to get started.
Selenium
Selenium is a library and tool used for automating web browsers to do a number of tasks. One of such is web-scraping to extract useful data and information that may be otherwise unavailable. Craigslist has recently made it not possible to use rvest to scrape the data, by requiring only a browser with javascript capabilities to query the webpage
In such cases, you can use RSelenium to scrape the data. Rselenium is a binding for Selenium framework where a web browser can be controlled programmatically to navigate and interact with web pages. It is useful to use a headless browser, which is a browser that does not have a graphical user interface. This is useful when you are running the code on a server or in a cloud environment. But for this work, you need to have appropriate ports not blocked by firewalls. We use netstat package to find a free port to use. wdman is a package that helps manage the webdriver.
#install.packages("RSelenium")
library(RSelenium)
library(wdman)
library(netstat)


#remDr$close() # Close the browser if you had one started before.

rD <- rsDriver(browser = 'firefox',
               verbose =F,
               chromever = NULL,
               phantomver = NULL,
               port = free_port()) # Sometimes these ports are blocked by the firewall. You can change the port number to something else. Or check with your system administrator.
remDr <- rD[["client"]]

remDr$navigate(query_url) # Navigate to the url

Sys.sleep(2) # give the page time to fully load
html_page <- remDr$getPageSource()[[1]]
#  # Close the browser whenever you are done with it.
Using rvest to extract data from html
The workhorse functions we are going to use are html_elements and html_element from the rvest library. html_element always extracts exactly one element. In this instance we want to extract all elements that are of cl-search-result class of element div.
#(raw_query <- read_html(query_url))

raw_query <- read_html(html_page)

## Select out the listing ads
raw_ads <- html_elements(raw_query, "div.cl-search-result")
raw_ads %>% head()
# {xml_nodeset (6)}
# [1] <div data-pid="7889542394" class="cl-search-result cl-search-view-mode-ga ...
# [2] <div data-pid="7889541038" class="cl-search-result cl-search-view-mode-ga ...
# [3] <div data-pid="7889517114" class="cl-search-result cl-search-view-mode-ga ...
# [4] <div data-pid="7889378662" class="cl-search-result cl-search-view-mode-ga ...
# [5] <div data-pid="7889345678" class="cl-search-result cl-search-view-mode-ga ...
# [6] <div data-pid="7889328379" class="cl-search-result cl-search-view-mode-ga ...
In the following bit of code, I extract the entire list of attributes that are part of each result-row. In particular, I want to extact id, title, price, date and metadata. Notice how each of them require some special manipulation to get into a right format.
ids <-
  raw_ads %>%
  html_attr('data-pid')

titles <-
  raw_ads %>%
   html_element("a.posting-title") %>%
   html_text()

prices <-
   raw_ads %>%
     html_element("span.priceinfo") %>%
     html_text() %>%
     str_replace_all("\\$|,+", "") %>% # This is a function that includes a regular expression to extract a special symbols $ and , and replace them with nothing.
     as.numeric()

metadata <-
  raw_ads%>%
  html_element('div.meta') %>%
  html_text()
Exercise
-
Notice the different functions
html_attrandhtml_textthat are used in different situations. Can you explain which is used when? -
Examine when you need to use “.” within html_node and when you don’t?
-
Parse the metadata to extract the date of posting, number of bedrooms, sq.ft and locale
-
Use selectorgadget Chrome extension or bookmarklet to figure out which elements to extract more easily.
Extracting location attributes
Location of the apartments/houses are little bit more tricky because they are not embedded in the results page, but in each individual ad. To access them we need to access individual urls for the ads and then extract the location attributes.
To do this we use the map_* function in purrr package. The function is effectively like a for loop. So the following code for each of the element of urls use the function(x) and then combine them into a table using row binding.
To avoid being blocked by craigslist server, we use Sys.sleep(1) to pause for a second between each request. This makes the loop a time consuming process, but is necessary to avoid being blocked by the server. I am going to demonstrate the loop only for 30 urls here for brevity. You can run it for all the urls in your own time.
urls <-
  raw_ads %>%
  html_element(".cl-app-anchor") %>%
  html_attr("href")

selection_num <- 30
urls <- urls[1:selection_num] # For brevity only first 10 urls

latlongs <- map_dfr(urls, function(x){
    remDr$navigate(x) # Navigate to the url
    Sys.sleep(1) # give the page time to fully load
    html_page2 <- remDr$getPageSource()[[1]]
    xml2::read_html(html_page2) %>%
      html_element("#map") %>%
      html_attrs() %>%
      t() %>%
      as_tibble() %>%
      select_at(vars(starts_with("data-"))) %>%
      mutate_all(as.numeric)
  }
  )

latlongs
# # A tibble: 30 × 3
#    `data-latitude` `data-longitude` `data-accuracy`
#              <dbl>            <dbl>           <dbl>
#  1            42.4            -71.1              15
#  2            42.5            -70.9              10
#  3            42.4            -71.1              15
#  4            42.4            -71.1               5
#  5            42.8            -71.5              22
#  6            42.4            -71.3              20
#  7            42.4            -71.2              20
#  8            42.5            -70.9              10
#  9            42.3            -71.1              22
# 10            42.1            -71.4              22
# # ℹ 20 more rows
Exercise
-
It is useful to go through each step of the function and see why they result in the lat longs finally.
-
Extract the number of pictures posted on the ad and relate it to the rent charged.
Geocoding addresses
Notice the data-accuracy field in the results. It is not clear, if the lat longs provided by the craigslist are accurate. It is useful to geocode the addresses to get a more accurate location. We first extract the addresses that are in each page and then geocode them using tidygeocoder package.
But first, let’s limit the data that we already collected to the 30 urls that we are using for this demonstration.
ids <- ids[1:selection_num]
titles <- titles[1:selection_num]
prices <- prices[1:selection_num]
metadata <- metadata[1:selection_num]


addresses <- map_dfr(urls, function(x){
    remDr$navigate(x) # Navigate to the url
    Sys.sleep(1) # give the page time to fully load and don't run afoul of rate limits
    html_page2 <- remDr$getPageSource()[[1]]

    id <- str_split(x, "(.*)/")[[1]][2] %>% tools::file_path_sans_ext()

    title <- read_html(html_page2) %>%
      html_element("span#titletextonly") %>%
      html_text()

    addr <- read_html(html_page2) %>%
      html_element("h2.street-address") %>%
      html_text()

    return(bind_cols(pid = id, title = title, full_addr = addr))

  }
  )

head(addresses)
# # A tibble: 6 × 3
#   pid        title                                                     full_addr
#   <chr>      <chr>                                                     <chr>
# 1 7889542394 Amazing North Cambridge Apartment                         Cedar St…
# 2 7889541038 3 bedroom, 2 bathroom renovated home                      294 Esse…
# 3 7889517114 Large spacious all new 4 Bedroom , 2 Bathroom Apt for Re… Orchard …
# 4 7889378662 New 2 Bed 2 Bath w/ UNIT LAUNDRY- GARAGE PARKING - AC - … Corey St…
# 5 7889345678 **FREE RENT SPECIAL!!**SPACIOUS 2 BEDROOM DELUXE WITH FI… 170 Conc…
# 6 7889328379 Charming 2-Bedroom Single Family Home for Rent in North … mountain…

library(tidygeocoder)
library(sf)

  addresses_geocode <- addresses %>%
    geocode_combine(
      queries = list(list(method = 'census'), list(method = 'arcgis')),
      global_params = list(address = 'full_addr'), cascade = TRUE)


# Now Check to see if the distances between lat long and craigslist lat long


craigslist_table <- cbind(ids, titles, urls, latlongs, prices) %>%
                    as_tibble

craigslist_table <- craigslist_table %>%
  left_join(addresses_geocode, by=c("ids" = "pid"))

craigslist_table
# # A tibble: 30 × 12
#    ids      titles urls  `data-latitude` `data-longitude` `data-accuracy` prices
#    <chr>    <chr>  <chr>           <dbl>            <dbl>           <dbl>  <dbl>
#  1 7889542… Amazi… http…            42.4            -71.1              15   4650
#  2 7889541… 3 bed… http…            42.5            -70.9              10   3650
#  3 7889517… Large… http…            42.4            -71.1              15   4500
#  4 7889378… New 2… http…            42.4            -71.1               5   2650
#  5 7889345… **FRE… http…            42.8            -71.5              22   2100
#  6 7889328… Charm… http…            42.4            -71.3              20   3200
#  7 7889231… *Spac… http…            42.4            -71.2              20   4500
#  8 7889226… 3 Bed… http…            42.5            -70.9              10   2950
#  9 7889158… Bosto… http…            42.3            -71.1              22   3500
# 10 7889122… White… http…            42.1            -71.4              22   2352
# # ℹ 20 more rows
# # ℹ 5 more variables: title <chr>, full_addr <chr>, lat <dbl>, long <dbl>,
# #   query <chr>

craigslist_table$dist_err <- diag(geosphere::distm(craigslist_table[,c("data-longitude", "data-latitude")], craigslist_table[,c("long", "lat")]))


craigslist_table %>% arrange(-`data-accuracy`) %>% glimpse()
# Rows: 30
# Columns: 13
# $ ids              <chr> "7889051723", "7889345678", "7889158492", "7889122400…
# $ titles           <chr> "Absolutley Gorgeous & Spacious Ayer Mansion Suites 2…
# $ urls             <chr> "https://boston.craigslist.org/nwb/apa/d/lowell-absol…
# $ `data-latitude`  <dbl> 42.64850, 42.77900, 42.29730, 42.09350, 42.55190, 42.…
# $ `data-longitude` <dbl> -71.32830, -71.47480, -71.07450, -71.40580, -71.25180…
# $ `data-accuracy`  <dbl> 99, 22, 22, 22, 22, 22, 22, 22, 22, 22, 22, 22, 22, 2…
# $ prices           <dbl> 2850, 2100, 3500, 2352, 2103, 3488, 3500, 2638, 3625,…
# $ title            <chr> "Absolutley Gorgeous & Spacious Ayer Mansion Suites 2…
# $ full_addr        <chr> NA, "170 Concord St, Nashua, NH 03064", NA, "10 Indep…
# $ lat              <dbl> NA, 42.78968, NA, 42.05982, 42.54221, 42.43790, 42.38…
# $ long             <dbl> NA, -71.46928, NA, -71.39399, -71.28571, -71.42923, -…
# $ query            <chr> "", "census", "", "census", "census", "census", "cens…
# $ dist_err         <dbl> NA, 1269.406981, NA, 3866.728457, 2985.981177, 4948.7…
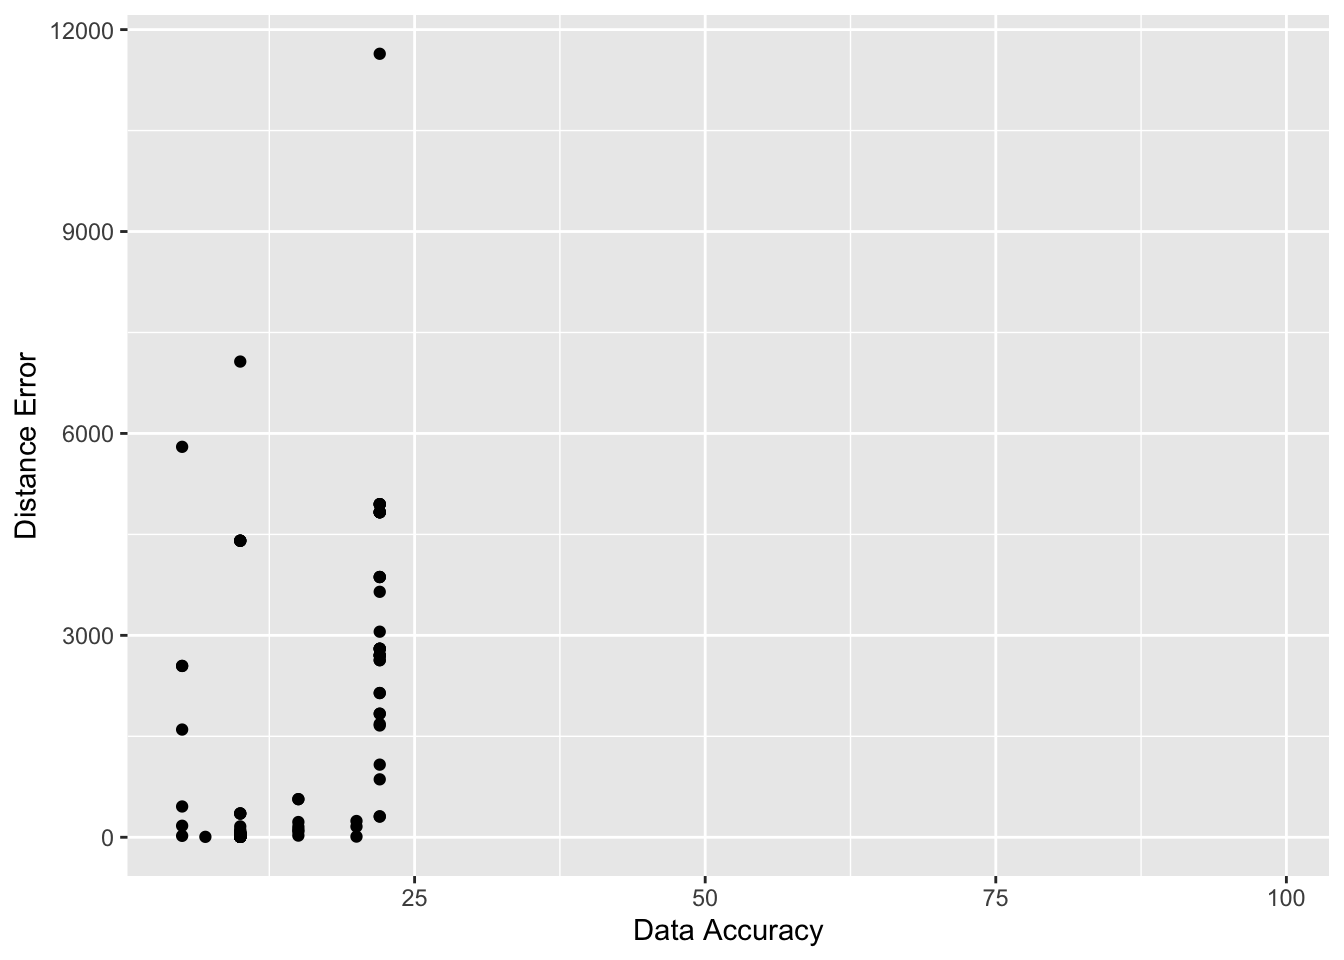
Notice all the missing addresses with ‘high-accuracy’. Clearly the text address is an incomplete data. However, can you trust the CL created longitude and latitude?
library(ggplot2)

ggplot() +
  geom_point(aes(x = `data-accuracy`, y = `dist_err`), data = craigslist_table) +
  labs(x = "Data Accuracy", y = "Distance Error")
Exercise
- What can you infer from this graph? How does this condition your analysis further?
Now we are ready to combine them all into one table and visualise the results.
tmap_mode("view")

craigslist_sf <- st_as_sf(craigslist_table, coords = c("data-longitude", "data-latitude"), crs = 4326)

m1 <-
  tm_shape(craigslist_sf) +
  tm_bubbles(fill  = "prices") +
  tm_basemap("CartoDB.Positron")


library(widgetframe)
frameWidget(tmap_leaflet(m1))
Navigating to next page
The above code only extracts the first page of the results. To extract all the results, we need to navigate to the next page and extract the results. We can do this by clicking on the next button and then extracting the results. We can do this programmatically using Selenium and finding the button element and clicking on it.
remDr$navigate(query_url)
nextbutton <- remDr$findElement(using = 'css selector', value = 'button.cl-next-page')
nextbutton$clickElement()
Sys.sleep(3)
html_page2 <- remDr$getPageSource()[[1]]
raw_ads <- html_elements(read_html(html_page2), "div.cl-search-result")
raw_ads %>% head()
Exercise
-
Figure out how to loop through various pages to extract all the results. Do not repeat the code again and again, but try and use loops or functions.Figure out when you should end your loop. The more quickly you ping the server with your queries, you will run afoul of rate limits and may raise some eyebrows in San Francisco. Use
Sys.sleepto slow down the query rate. -
Repeat this for few other urban areas, such as Los Angeles and Raleigh.
-
Do not forget to close your webdriver with
remDr$close()when you are exiting the script.
Cautions & Conclusions
Scraping the web to create a structured dataset is as much an art as it is a technical exercise. It is about figuring out the right combinations of searches and manipulations that will get you right result. And because there are no documentation and manuals, it is imperative to experiment with it and fail. And you will fail often. The webpages change their structure over time and the code that might work one week may not work the next. The webpages themselves are dynamic and therefore the dataset that you generate may not be replicable. All these should be taken into account when you are scraping the web for data and conducting your analyses.
Nikhil Kaza
Professor
My research interests include urbanization patterns, local energy policy and equity