class: right, bottom ## Transportation Energy and Urban Form ##### Nikhil Kaza ##### Associate Professor, Department of City & Regional Planning <br /> Adjunct Associate Professor, Environment, Ecology and Energy Program <br /> University of North Carolina at Chapel Hill ##### nkaza@unc.edu ##### sia.planning.unc.edu ###### updated: 2019-10-24 .footnote[ see Kaza, N. "Urban Form and Transportation Energy Consumption". In: _Energy Policy_. ]f --- # What We Know... .pull-left[ 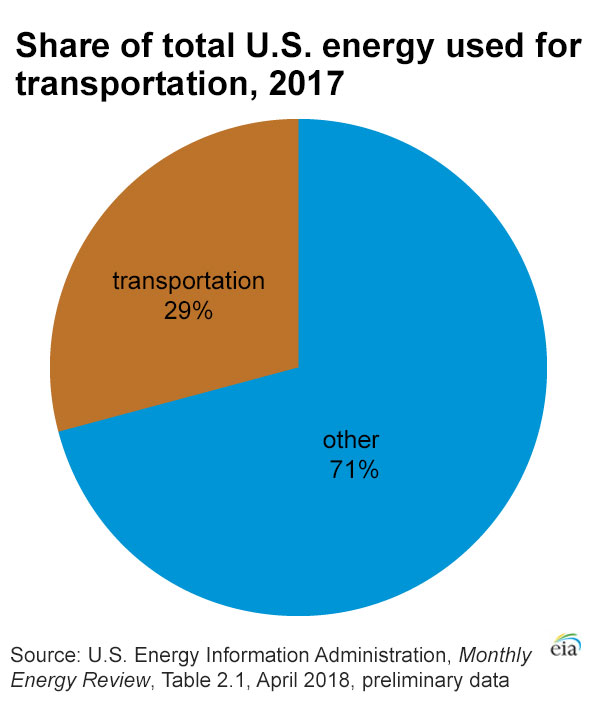 .caption[Almost a third of energy consumption is from the transport sector] ] .pull-right[ * 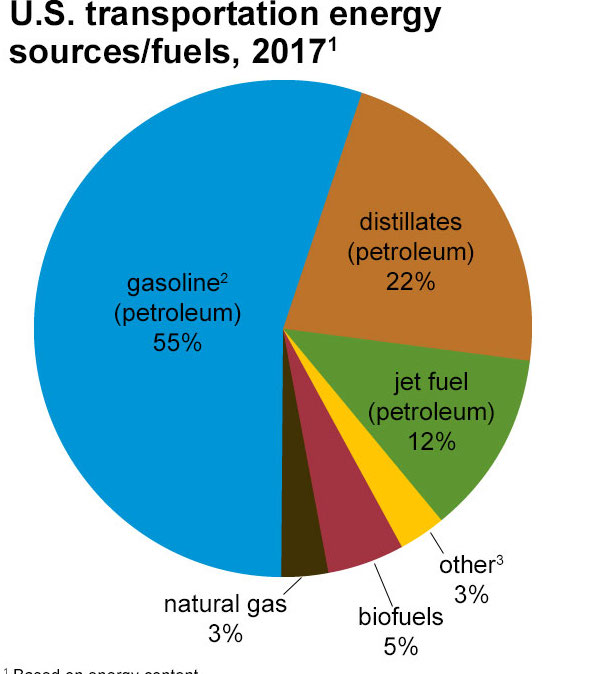 .caption[Almost all of transportation fuels are liquid petroleum based fuels] ] --- # What We Know... <img src="./figs/passenger-freight-proportions.png" width="100%" /> .caption[While passenger travel is important component of travel, on-road freight is often ignored] --- # What We Know... .pull-left[ 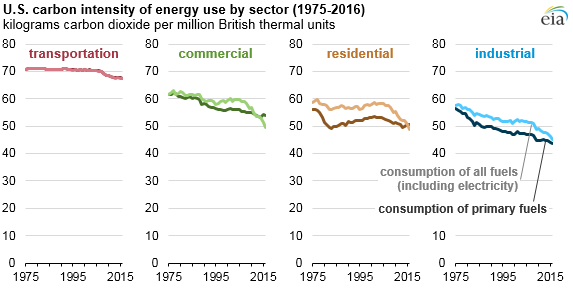 .caption[Transportion sector showed the slowest per capita declines] ] .pull-right[  .caption[ Despite increases in efficiency of the fleet, consumption is rising] ] --- # What We Know... .pull-left[ 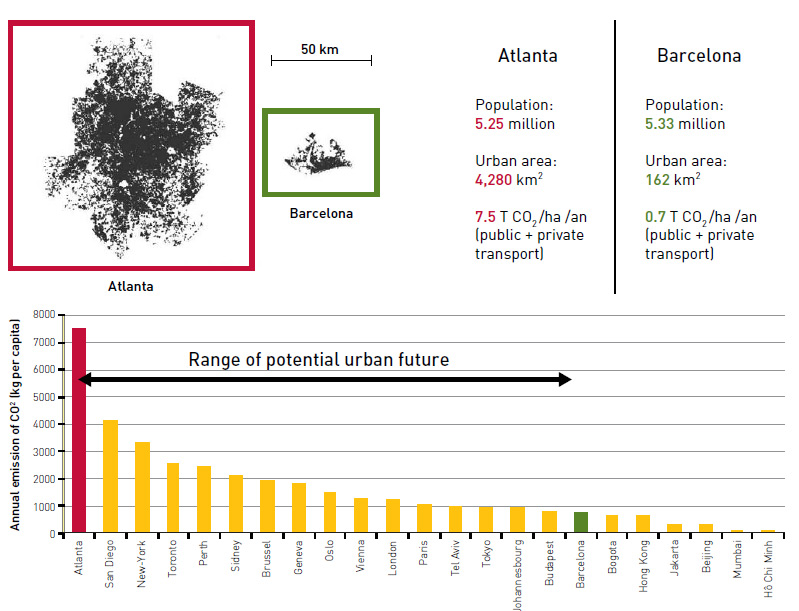 .caption[Newman & Kenworthy 1999] ] .pull-right[ 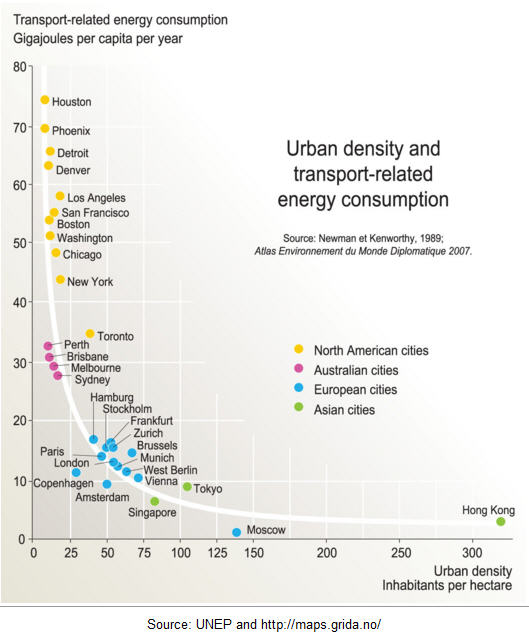 .caption[Newman & Kenworthy 1989] ] --- # Theoretical Basis <div id="container-flex"> <div> <img src="./figs/maxdisorder.jpg" width="175" height="175"> </img> <p class='caption'> Maximum Disorder </p> </div> <div> <img src="./figs/livework.jpg" width="175" height="175"> </img> <p class='caption'> Live Work </p> </div> <div> <img src="./figs/monocentric.jpg" width="175" height="175"> </img> <p class='caption'> Monocentric </p> </div> <div> <img src="./figs/polycentric.jpg" width="175" height="175"> </img> <p class='caption'> Polycentric </p> </div> <div> <img src="./figs/constraineddispersal.jpg" width="175" height="175"> </img> <p class='caption'> Constrained Dispersal </p> </div> </div> .footnote[ see Angel, Shlomo and Alejandro M. Blei (2016). "The spatial structure of American cities: The great majority of workplaces are no longer in CBDs, employment sub-centers, or live-work communities". In: _Cities_ 51. Current Research on Cities, pp. 21 - 35. ISSN: 0264-2751. DOI: [https://doi.org/10.1016/j.cities.2015.11.031](https://doi.org/https%3A%2F%2Fdoi.org%2F10.1016%2Fj.cities.2015.11.031). URL: [http://www.sciencedirect.com/science/article/pii/S0264275115300238](http://www.sciencedirect.com/science/article/pii/S0264275115300238). ] --- # A Consideration  .caption[% Vehicle Miles Travelled (VMT) by trip purpose in 2017 National Household Travel Survey] * Vast majority of the travel in the US is not for commuting. * We need to account for strategies to make non-work travel efficient as well. * Only partially addressed in this work. --- # Research Questions * How does urban form impact in transportation energy? * At a sub-national scale, what are the patterns of transportation energy consumption? * How to measure them? * How does urban form affect energy consumption? * How to effectively measure urban form at a continental scale? * Which measures of urban form are important? --- # Transportation Energy * Energy consumed is mostly in the form of liquid fuels sold at specialised retail stores (Gas stations) * Revenue of gas stations as a proxy for energy consumption at a location * Census Bureau conducts an economic census every 5 years (ending in 2 & 7) * Other census/surveys exist but not enough geographic or sector detail. * Revenues for each county for each 6 digit NAICS code (subject to data supression) * 44-45 (Retail), * 447 (Gasoline stations) * 447110 (Gasoline stations with convenience stores) * 447190 (Other gasoline stations) ## Construct Validity Issues * Different liquid fuels (Gasoline, Diesel, Gasahol etc.) * Spatial and temporal hetereogeneity in prices * Spending at gas stations include spending at attached convenience stores --- # More on Construct Validity... .pull-left[ <div id="htmlwidget-d0cbad67b5d90a7ed291" style="width:100%;height:576px;" class="widgetframe html-widget"></div> <script type="application/json" data-for="htmlwidget-d0cbad67b5d90a7ed291">{"x":{"url":"figs//widgets/widget_unnamed-chunk-4.html","options":{"xdomain":"*","allowfullscreen":false,"lazyload":false}},"evals":[],"jsHooks":[]}</script> ] .pull-right[ * Data is available only for 835 counties. * High correlation, but some bias * Very few places have enough number of gas stations only establishments. ] --- # Per Capita Sales in Gas Stations * 3,109 counties in CONUS * 344 counties have data suppression <div id="htmlwidget-e6ae63faa6ed5801807c" style="width:100%;height:576px;" class="widgetframe html-widget"></div> <script type="application/json" data-for="htmlwidget-e6ae63faa6ed5801807c">{"x":{"url":"figs//widgets/widget_leaflet-01.html","options":{"xdomain":"*","allowfullscreen":false,"lazyload":false}},"evals":[],"jsHooks":[]}</script> --- # Consumption by County Character<sup>*</sup> <div id="htmlwidget-866e802e79b4c5979363" style="width:100%;height:50%;" class="widgetframe html-widget"></div> <script type="application/json" data-for="htmlwidget-866e802e79b4c5979363">{"x":{"url":"figs//widgets/widget_unnamed-chunk-5.html","options":{"xdomain":"*","allowfullscreen":false,"lazyload":false}},"evals":[],"jsHooks":[]}</script> .footnote[[*] County character classification by National Center for Health Statistics] ??? Counties outside metropolitan statistical areas have 41.2% more per capita sales than those within them. While these counties account for only 16.2% of the total population, this suggests that urbanization is associated with lower per capita consumption due to proximity of destinations and increased economic development. Finer urban type classification of the counties from National Center for Health Statistics (NCHS) reveal an even starker pattern. Large central metro counties, on average, have two fifths of the per capita sales of the non-core rural counties. As the urbanization intensifies, per capita consumption decreases (see Table below), even though large and medium metro counties account for more than two-thirds of the total sales. --- # Consumption by County Character<sup>*</sup> | County Type | Annual Sales (Millions) | Per capita Sales | | :-----------------|------------------------------:| -----------------:| |Non-core | 47.3 | $3,725 | |Micropolitan | 110.1 | $2,622 | |Small Metro | 190.1 | $2,400 | |Medium Metro | 333.8 | $1,975 | |Large Fringe Metro | 363.7 | $1,775 | |Large Central Metro|1,753.2 | $1,285 | .footnote[[*] County classification by National Center for Health Statistics] ??? Finer urban type classification of the counties from National Center for Health Statistics (NCHS) reveal an even starker pattern. Large central metro counties, on average, have two fifths of the per capita sales of the non-core rural counties. As the urbanization intensifies, per capita consumption decreases (see Table below), even though large and medium metro counties account for more than two-thirds of the total sales. --- # Measuring Urban Form Characteristics * Urban landscape measures (Fragmentation, Compactness, Level of Urbanisation, Terrain...) * Demographic patterns (Concentration of population...) * Economic patterns (Centeredness of Employment, Size of Economy...) * Transporation investments & behaviour (Highway lane miles, Public transit usage..) * Other controls (Median Income, State fixed effects...) --- # Urban Landscape Metrics <img src="./figs/urbanform_concepts.jpg" width="70%" style="display: block; margin: auto;" /> .footnote[ see Kaza, N. (2013). "The changing urban landscape of continental United States". In: _Landscape and Urban Planning_ 110, pp. 74-86. URL: [http://dx.doi.org/10.1016/j.landurbplan.2012.10.015](http://dx.doi.org/10.1016/j.landurbplan.2012.10.015). ] --- # 2011 National Land Cover Database .right-column[ <img src="./figs/durham_lc.png" width="80%" /> ] .left-column[ * ~ 9 billion pixels for CONUS. * 30m resolution * 16 land cover classes * 4 Urban classes ] --- # Processing steps <div style="width: 40%; float: left;"> <img src="./figs/urban-lc-1.png" height="550"> </img> </div> <div style="width: 40%; float: right;"> <img src="./figs/urban-lc-4.png" height = "550"> </img> </div> --- # Processing steps... <div style="width: 40%; float: left;"> <img src="./figs/urban-lc-2.png" height="550"> </img> </div> <div style="width: 40%; float: right;"> <img src="./figs/urban-lc-3.png" height="550"> </img> </div> --- # Before & After <img src="./figs/processingmap.png" width="100%" style="display: block; margin: auto;" /> --- # Before & After... <img src="./figs/pre-post-violin-rural-mixed.jpg" width="65%" style="display: block; margin: auto;" /> .footnote[ see McCarty, J. and N. Kaza (2015). "Urban Form and Air Quality". In: _Landscape and Urban Planning_ 139, pp. 168-179. URL: [http://dx.doi.org/10.1016/j.landurbplan.2015.03.008](http://dx.doi.org/10.1016/j.landurbplan.2015.03.008). ] --- # Index of Moment of Inertia `$$IMI := \frac{A^2} {2 \pi \sum_{i} (\frac{r^2}{6} + d_i^2) \unicode{x1D7D9}_i}$$` <div id="htmlwidget-37a95cf681fb11ad9b59" style="width:100%;height:576px;" class="widgetframe html-widget"></div> <script type="application/json" data-for="htmlwidget-37a95cf681fb11ad9b59">{"x":{"url":"figs//widgets/widget_unnamed-chunk-12.html","options":{"xdomain":"*","allowfullscreen":false,"lazyload":false}},"evals":[],"jsHooks":[]}</script> .footnote[ see Li, Wenwen, Michael F. Goodchild, and Richard Church (2013). "An efficient measure of compactness for two-dimensional shapes and its application in regionalization problems". In: _International Journal of Geographical Information Science_ 27.6, pp. 1227-1250. ISSN: 1365-8816. DOI: [10.1080/13658816.2012.752093](https://doi.org/10.1080%2F13658816.2012.752093). URL: [http://dx.doi.org/10.1080/13658816.2012.752093](http://dx.doi.org/10.1080/13658816.2012.752093). ] --- # Index of Moment of Inertia <div id="htmlwidget-fc7e7be922b1d9532c1c" style="width:100%;height:50%;" class="widgetframe html-widget"></div> <script type="application/json" data-for="htmlwidget-fc7e7be922b1d9532c1c">{"x":{"url":"figs//widgets/widget_unnamed-chunk-14.html","options":{"xdomain":"*","allowfullscreen":false,"lazyload":false}},"evals":[],"jsHooks":[]}</script> --- # Employment Concentration <img src="./figs/lorenzcurve.png" width="2048" height="70%" style="display: block; margin: auto;" /> ~ 213,000 block groups in CONUS --- # Employment Concentration <div id="container-flex"> <div style="width: 40%"> <img src="./figs/clev1.png" height="250"> </img> </div> <div style="width: 10%"> <span style="font-weight:bold" style ="font-size:4em"> - </span> </div> <div style="width: 40%"> <img src="./figs/clev2.png" height="250"> </img> </div> </div> <div id="container-flex"> <img src="./figs/clev3.png" height="400"> </img> </div> .footnote[ see McMillen, Daniel P and T William Lester (2003). "Evolving subcenters: employment and population densities in Chicago, 1970-2020". In: _Journal of Housing Economics_ 12.1, pp. 60-81. ISSN: 1051-1377. DOI: [10.1016/S1051-1377(03)00005-6](https://doi.org/10.1016%2FS1051-1377%2803%2900005-6). URL: [http://www.sciencedirect.com/science/article/pii/S1051137703000056](http://www.sciencedirect.com/science/article/pii/S1051137703000056) (visited on Jan. 13, 2015). ] --- # Commuting Patterns <img src="./figs/clevelandempcenter_travel.png" width="60%" style="display: block; margin: auto;" /> .footnote[ see Hartley, D. A, N. Kaza, and T. W. Lester (2016). "Are America's Inner Cities Competitive? Evidence from the 2000s". In: _Economic Development Quarterly_ 30.2. URL: [http://dx.doi.org/10.1177/0891242416638932](http://dx.doi.org/10.1177/0891242416638932). ] --- # Pedestrian Oriented Intersection Density US EPA created Smart Location Database relying on NAVTEC street network. The following criteria are used to create pederstrian street facilities. * Any arterial or local street having a speed category of 6 (between 21 and 30 mph) where car travel is permitted in both directions * Any arterial or local street having a speed category of 7 or higher (less than 21 mph). * Any local street having a speed category of 6 (between 21 and 30 mph) * Any pathway or trail on which automobile travel is not permitted (speed category 8). * For all of the above, pedestrians must be permitted on the link * For all of the above, controlled access highways, tollways, highway ramps, ferries, parking lot roads, tunnels, and facilities having four or more lanes of travel in a single direction (implied eight lanes bi-directional) are excluded --- # Pedestrian Oriented Intersection Density <div id="htmlwidget-bd2a723714a621cebe1f" style="width:100%;height:576px;" class="widgetframe html-widget"></div> <script type="application/json" data-for="htmlwidget-bd2a723714a621cebe1f">{"x":{"url":"figs//widgets/widget_unnamed-chunk-19.html","options":{"xdomain":"*","allowfullscreen":false,"lazyload":false}},"evals":[],"jsHooks":[]}</script> --- # Statistical Methods Spatial Error Model $$ Y= \alpha+ \delta_i+ \beta X+ ϵ+ \lambda W \xi $$ $$ ϵ \sim N(0,σ^2 I) $$ Estimated through Maximum Likelihood Estimation * Unit of analysis: County * No. of Observations: 2,679 * Spatial Weights: First Order Queen Contiguity * Most variables are Inverse Hyperbolic Sine transformed. i.e. Interpretation of coefficient is (semi-)elasticity. --- # Results <img src="figs/unnamed-chunk-20-1.png" width="100%" /> --- # Results... <img src="figs/unnamed-chunk-21-1.png" width="100%" /> --- # Results... <img src="figs/unnamed-chunk-22-1.png" width="100%" /> --- # Variable Importance <img src="./figs/varImp.png" width="80%" style="display: block; margin: auto;" /> .footnote[ see Grömping, Ulrike (2006). "Relative Importance for Linear Regression in R: The Package Relaimpo". In: _Journal of Statistical Software_ 17.1, pp. 1-27. ] --- # Limitations * Fleets are ignored (e.g. public transit buses) * Sales are imperfect proxy for energy consumption * Accuracy of landcover data is 83% * Need to disaggregate the behaviours of passers-through and residents. Unclear if there is a structural bias * Is county the right unit of analysis? Household? Establishment? Metro area? * Omitted variables (e.g. weather, prices) * Not accounting for fleet mix, fleet efficiency, mode choice, distances and transport behaviours --- # Conclusions -- * Fragmentary urbanisation is associated with higher transportation energy consumption -- * Physical urban form characteristics are more important than demographic and economic patterns -- * Policy responses need to be regional in scope and should include multi-organisational coalitions -- * Land use planning could be important for sustainable transportation outcomes --- # Acknowledgements * Lauer, Caroline * Zeitlin, Joshua * Habitat Research Center & Laboratory of Urbanism at EPFL