Visualising Data with Grammar of Graphics

Nihil Kaza

4/27/23

Recap from last week

  • Installation R/Rstudio
  • Different data types in rectangular datasets
  • Used functions from tidyverse packages to explore AQI data
  • Good data analysis habits
  • Asking for help.
  • Joining, mutating, arranging datasets*

Today’s plan

  • Visualisation principles
  • Grammar of graphics
  • Visualisation with ggplot
  • Advanced techniques

Visualisation Principles

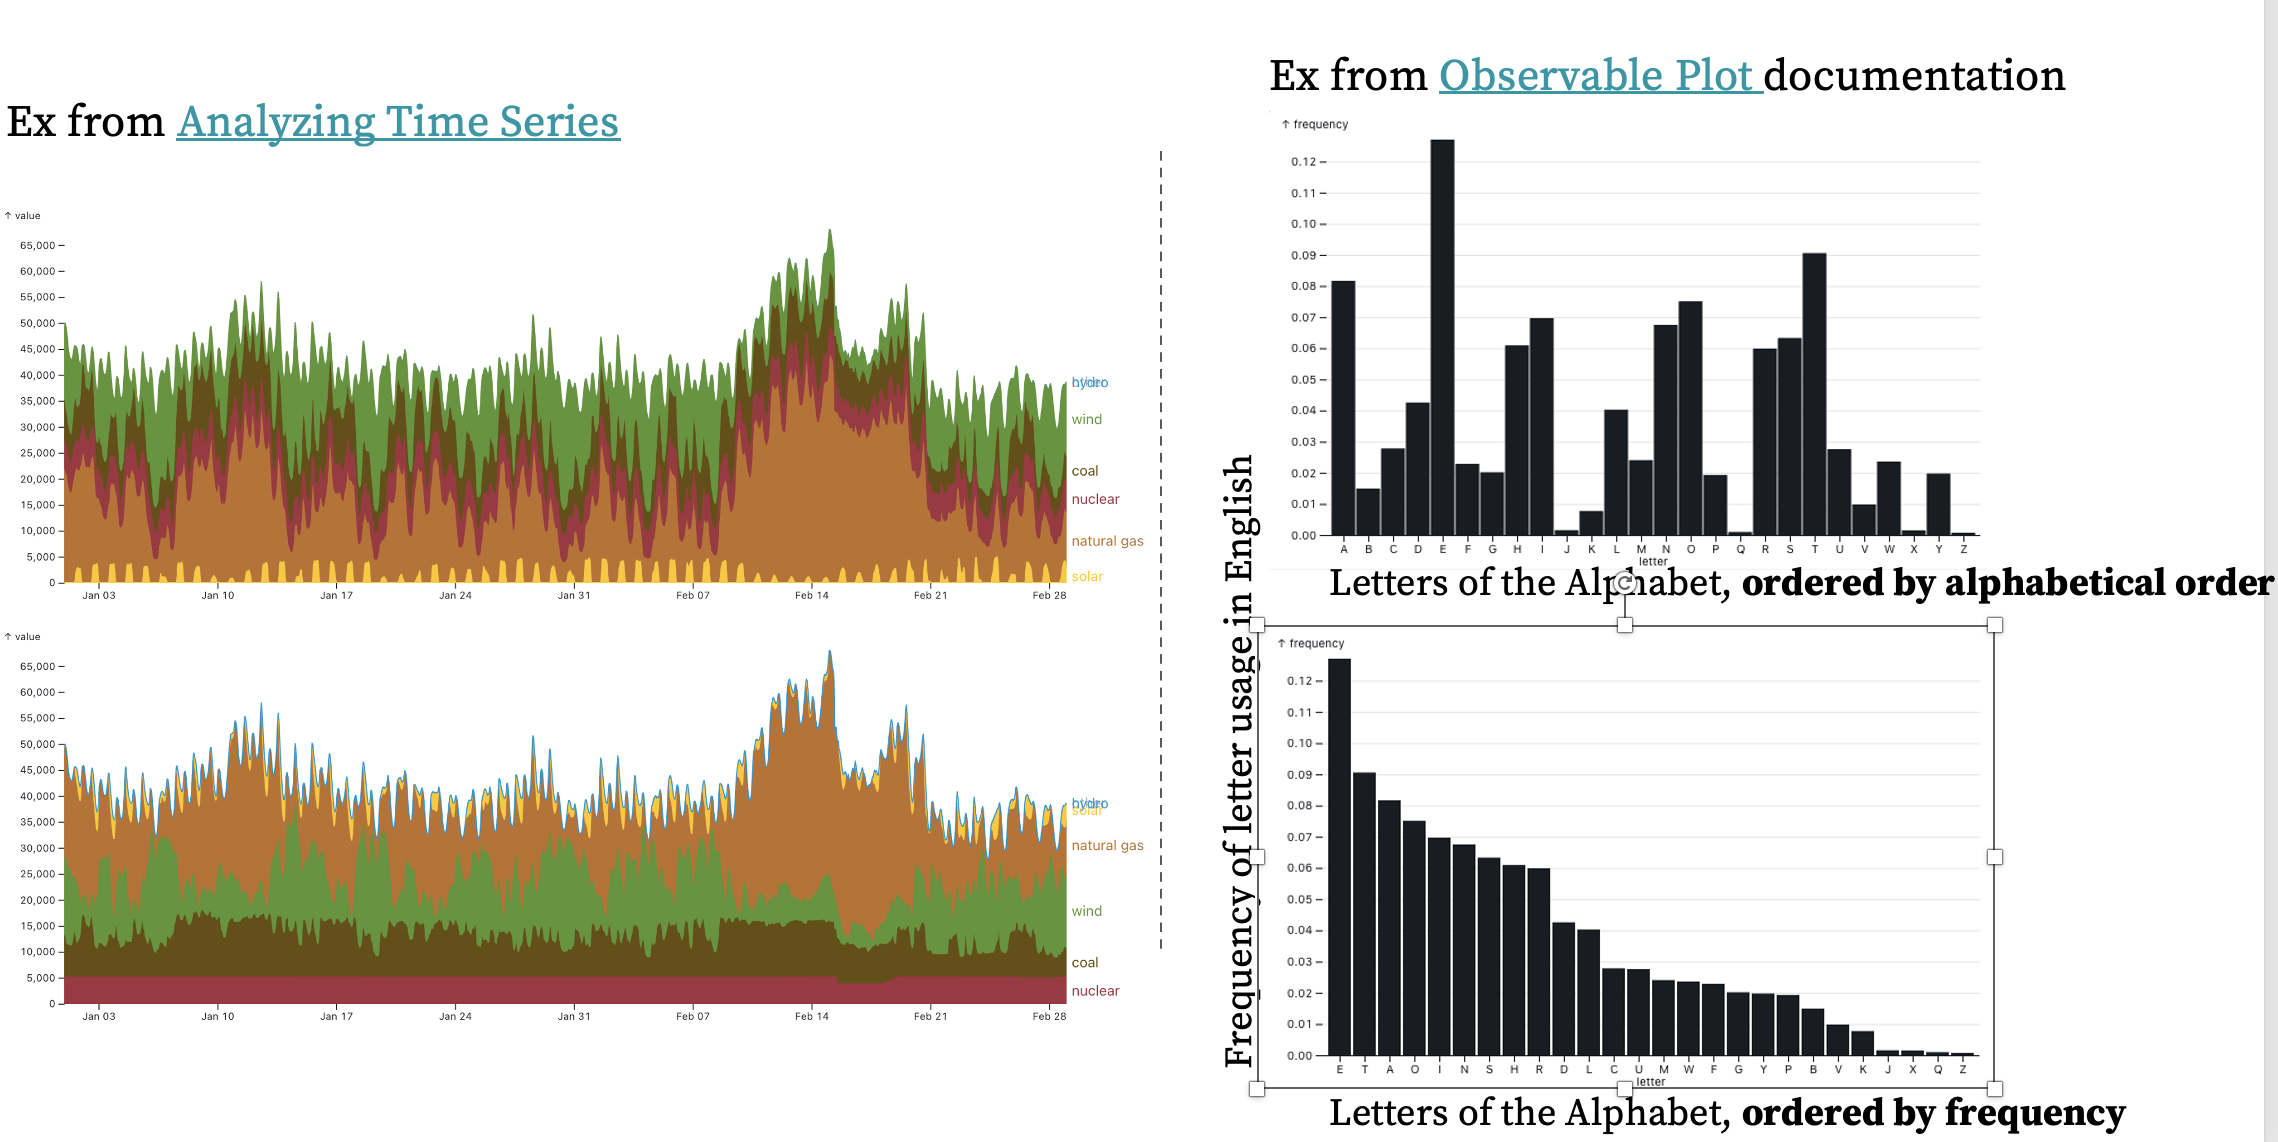
Focus attention by highlighting

Focus attention by stripping

Source: Zan Armstrong (2021) @ Observable

Order matters

Source: Zan Armstrong (2021) @ Observable

Avoid legends

Legends rely on visual association, which is hard.

Source: https://headwaterseconomics.org/dataviz/west-wide-atlas/

Channels - Data

Source: Munzer (2014)

Small multiples

Source: Wilke (2019)

Compound figures

Source: Onda et. al (2020)

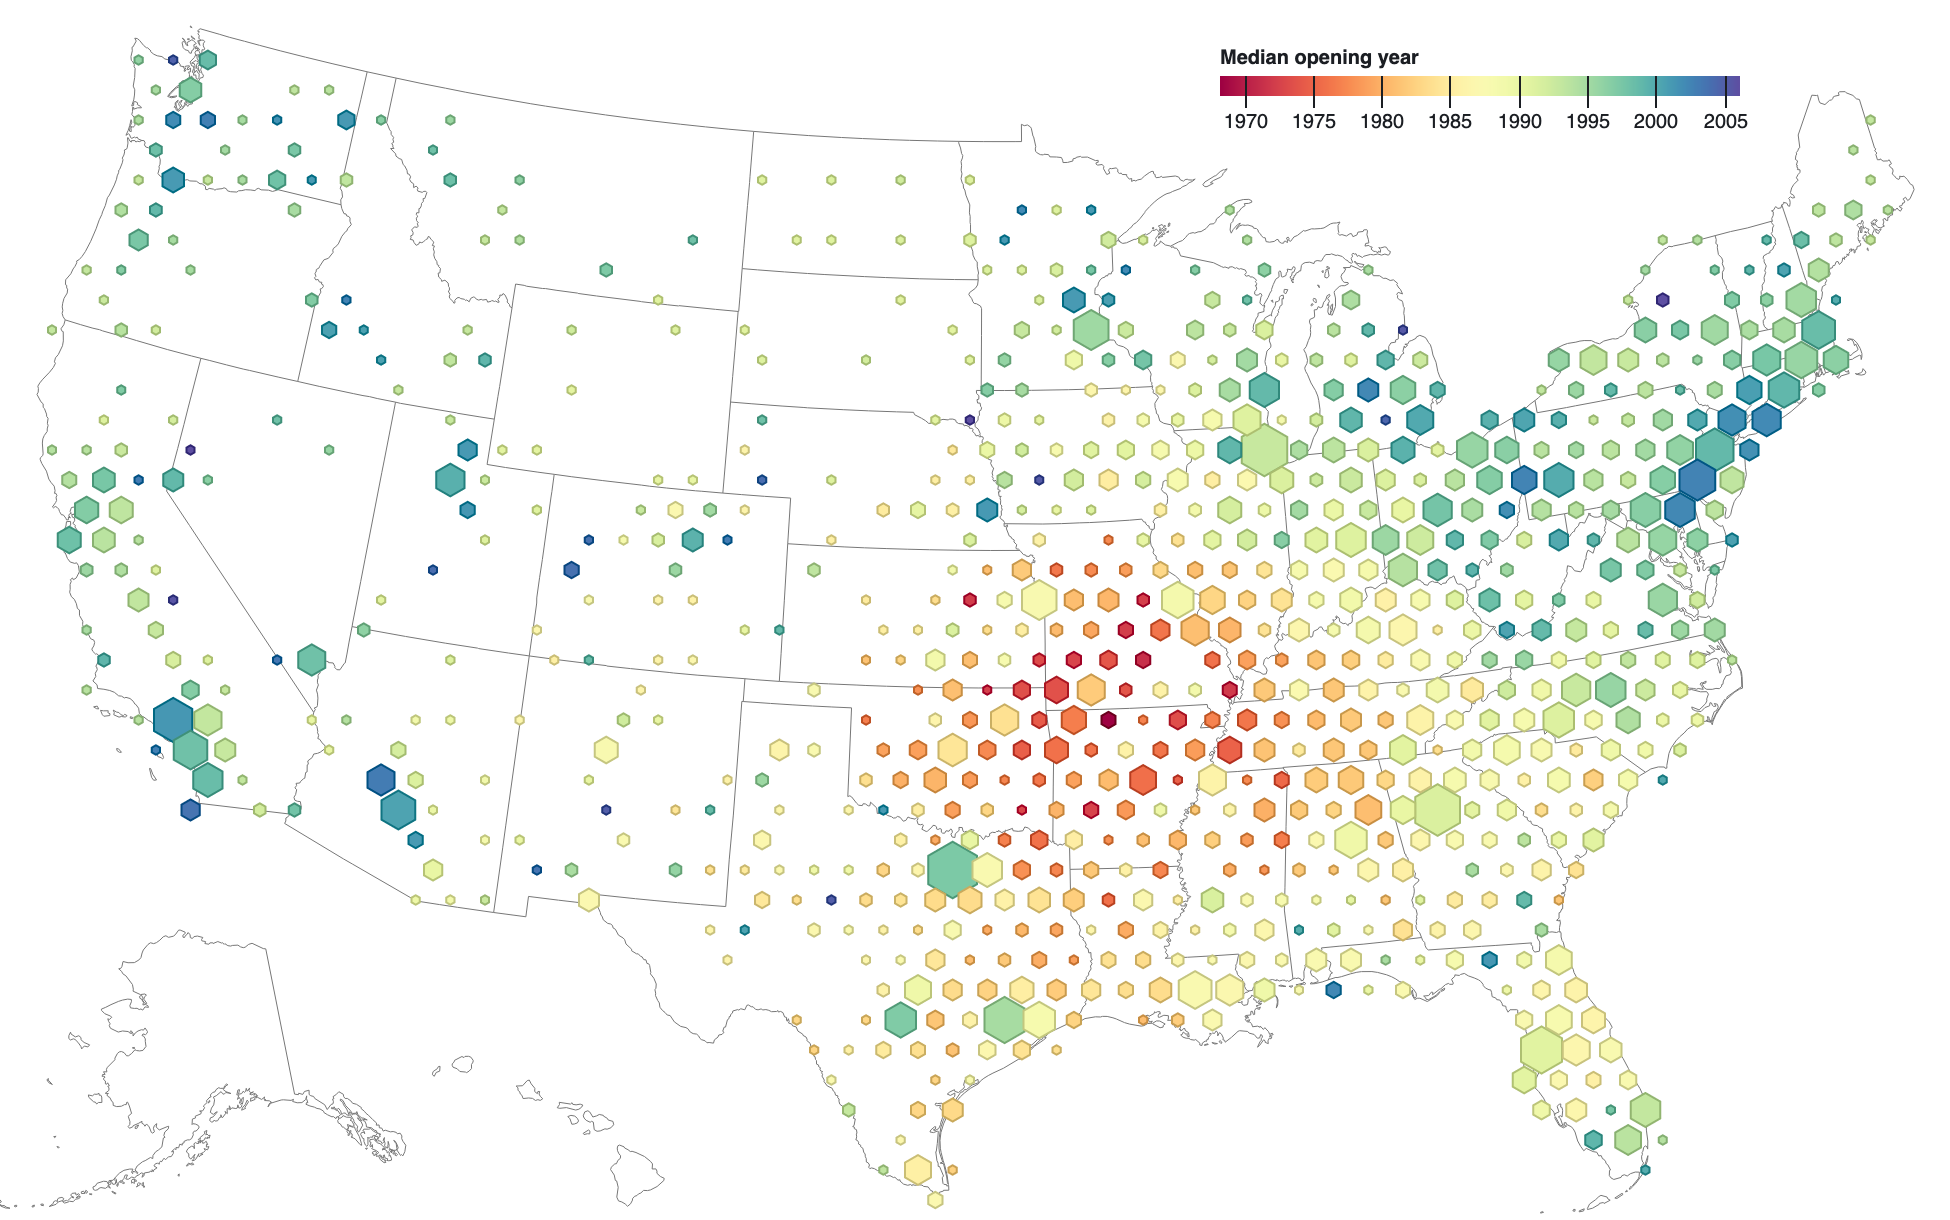
Spatial is not special

This map shows approximately 3,000 locations of Walmart stores. The hexagon area represents the number of stores in the vicinity, while the color represents the median age of these stores. Older stores are red, and newer stores are blue
Source: Mike Bostock @ Observable https://observablehq.com/@d3/hexbin-map

Accuracy is overrated

Source: Deetz and Adams (1921)

Precision even more so!

Source: Few (2017) https://www.perceptualedge.com/blog/?p=2596

Resources

Resources

Resources

Grammar of Graphics

Grammar of Graphics

ggplot2

ggplot2

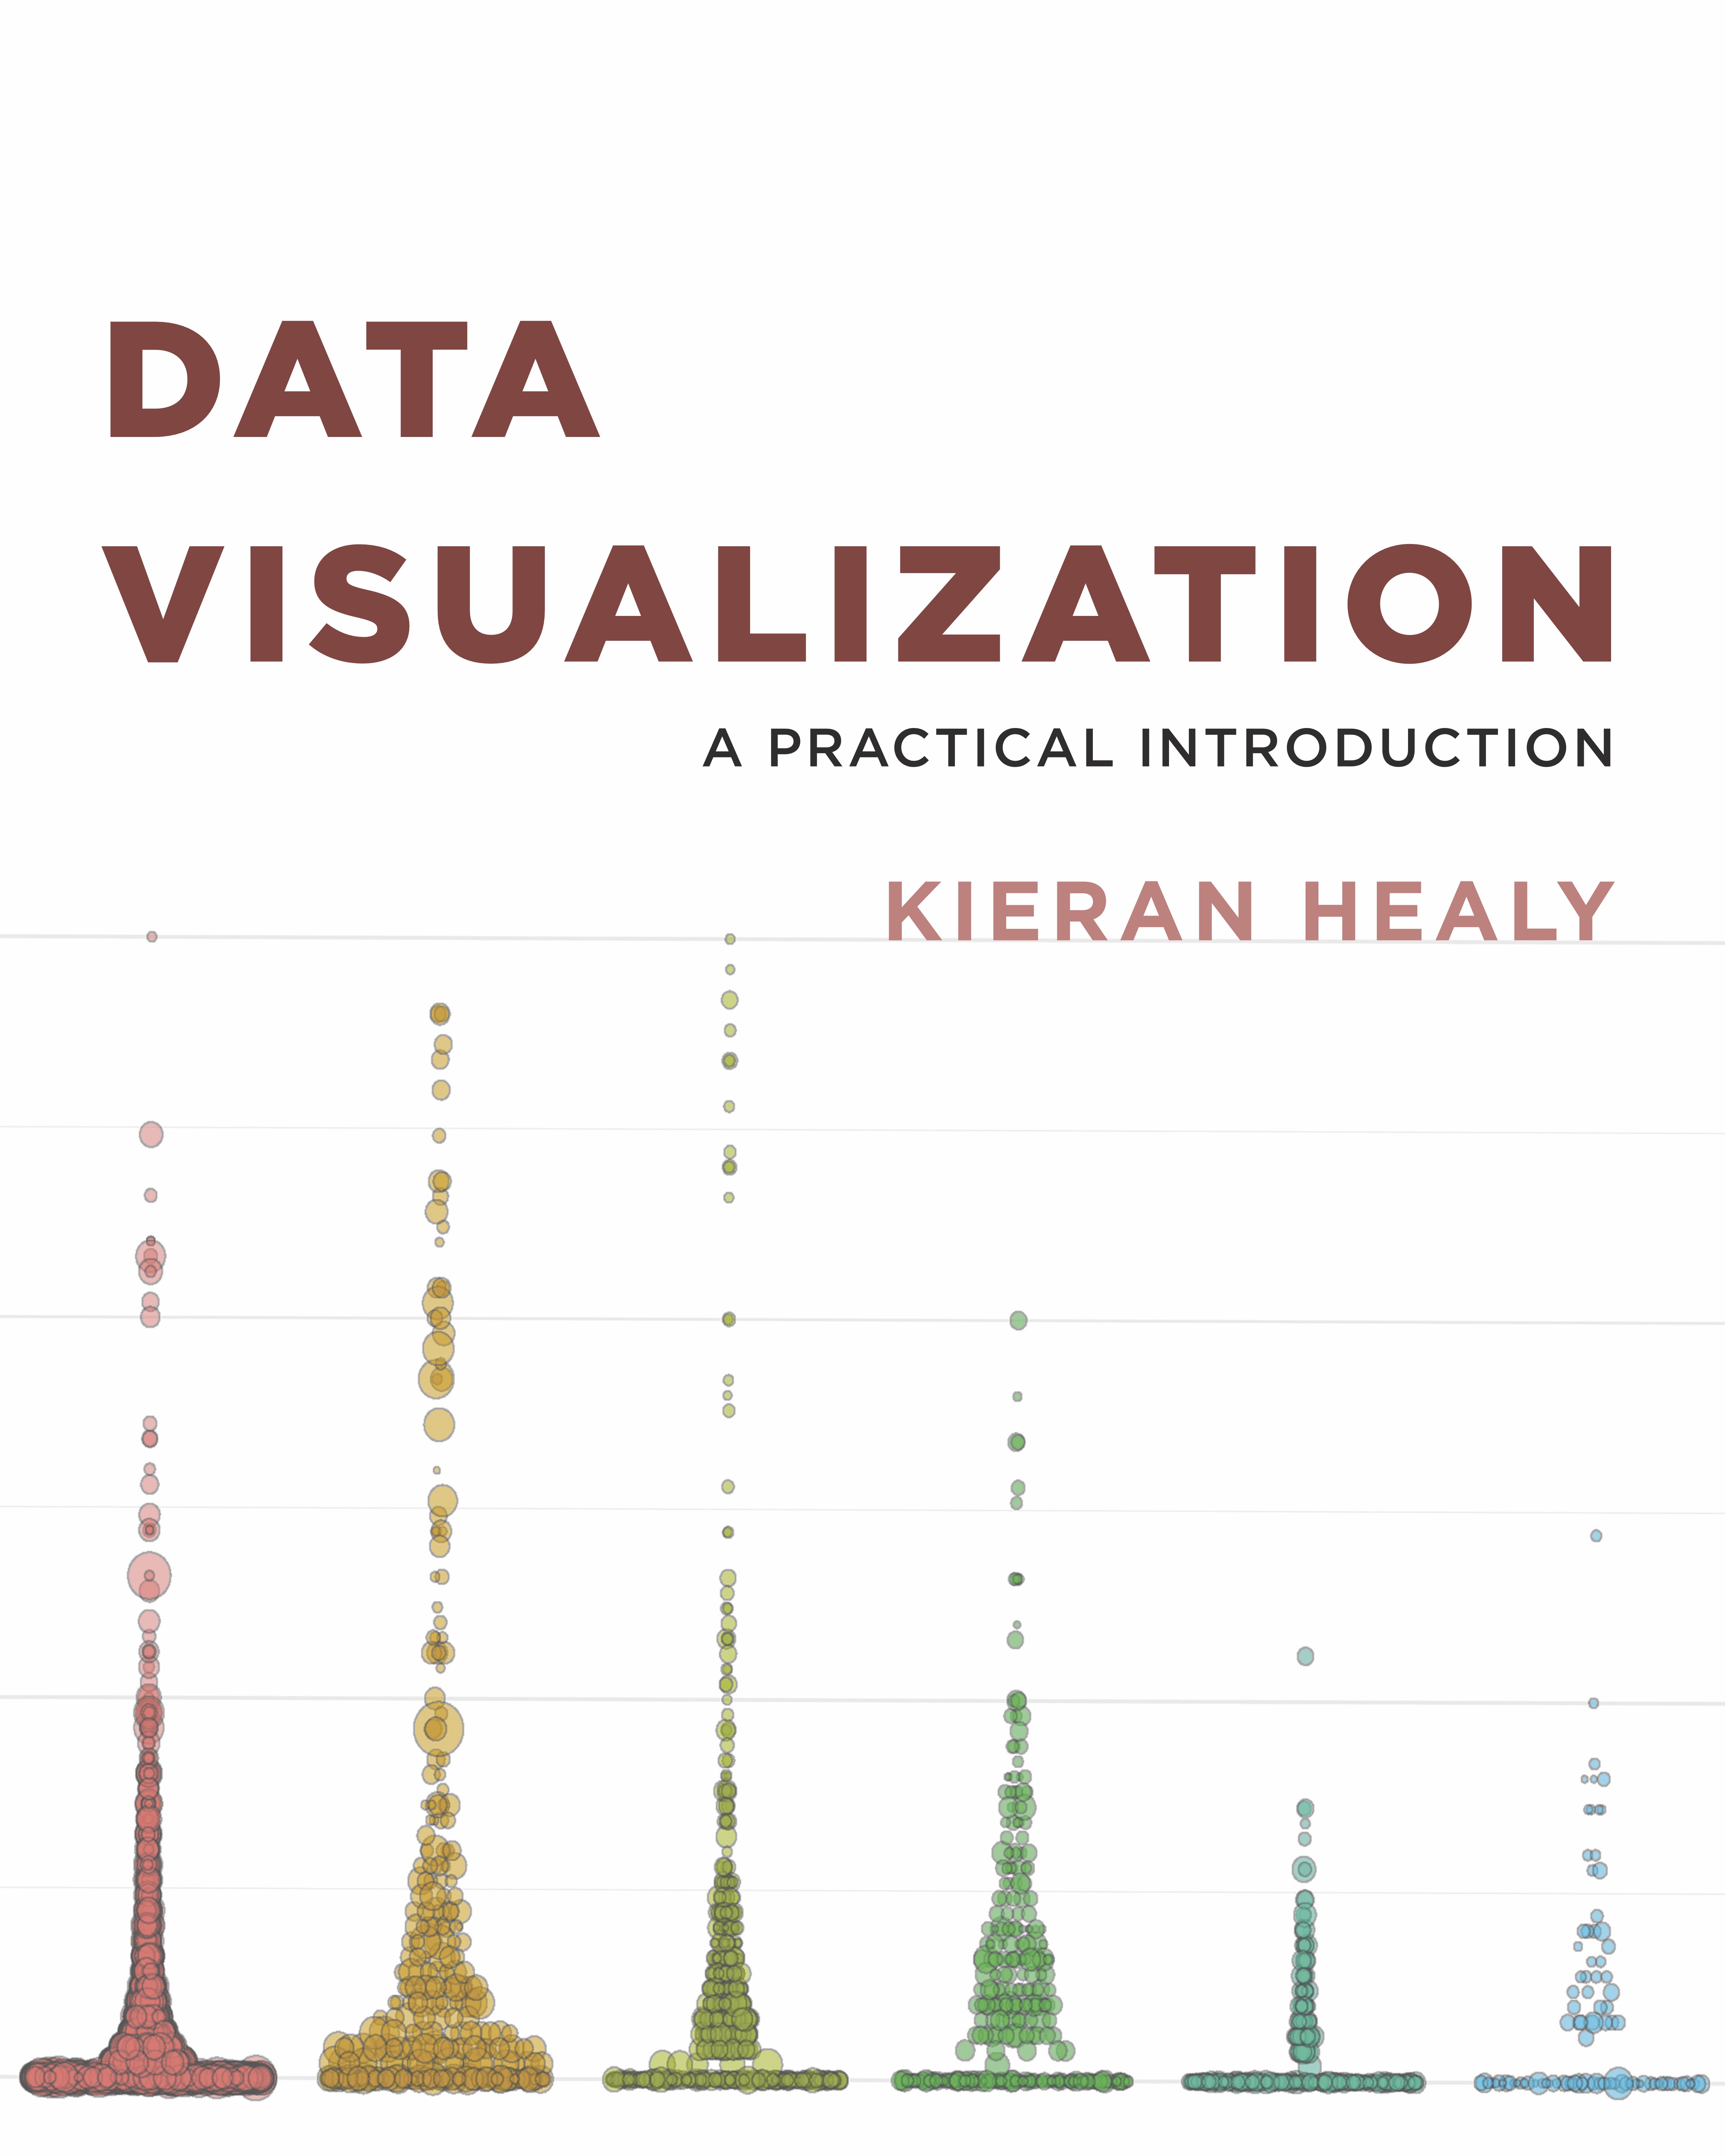
Source: Healey (2018)

Framework

Mapping data (Channels)

Encoding data into visual cues to highlight comparisons

A non-exhaustive list

  • length
  • position
  • size
  • shape
  • area
  • angle
  • colour

Visualisation with ggplot in R

Recall the dataset

Code
library(tidyverse)
library(here)
# Sys.setlocale("LC_TIME", "en_US.UTF-8") 
# Uncomment above line, if computer's locale is not in US.

AQI_tbl <- here("data", "raw", "AQI.csv") %>% 
    read_csv(locale = locale(encoding = "GBK"))

AQI_tbl <- AQI_tbl %>% 
  mutate(TIME = ymd_hm(TIME)) %>%
  mutate(month_of_obs = month(TIME, label =T)) %>%
  mutate(season = case_when(
       month_of_obs >= 3 & month_of_obs < 6 ~ "Spring",
       month_of_obs >=6 & month_of_obs < 9 ~ "Summer",
       month_of_obs >=9 & month_of_obs < 12 ~ "Autumn",
       month_of_obs = 12 | month_of_obs <3 ~ "Winter",
       .default = "NA"
        )
         ) %>% 
    mutate(time_of_obs = hour(TIME)) %>%
      mutate(time_of_day = case_when(
       time_of_obs >= 6 & time_of_obs < 10 ~ "Morning Peak",
       time_of_obs >= 10 & time_of_obs < 16 ~ "Off Peak (Day)",
       time_of_obs >= 16 & time_of_obs < 19 ~ "Evening Peak",
       time_of_obs >= 19 | time_of_obs < 6 ~ "Night",
       .default = "NA"
        )
         )%>%
    mutate(AQI = as.numeric(AQI)) %>%
    mutate(SITEID = as.character(SITEID)) %>%
    mutate(AIRQUALITY = factor(AIRQUALITY))

Build it by layer

Code
AQI_tbl %>%
    ggplot() 

Initialises a ggplot object. Prints nothing.

Build it by layer

Code
AQI_tbl %>%
    ggplot() +
    geom_point(aes(x=TIME, y=AQI, color = SITEID)) 

  • Map TIME to x scale (position), AQI to y scale (position), SITEID to colour scale (hue).
  • The default statistic is identity.
  • We use these statistics and scales to map on to point geometry
  • All other aspects of the visualisation have sensible defaults (such as Cartesian coordinates)

Build it by layer

Code
AQI_tbl %>%
    ggplot() +
    geom_point(aes(x=TIME, y=AQI, color = SITEID)) +
    scale_color_brewer(palette = "Set3") +
    scale_y_log10() +
    scale_x_datetime(date_labels = "%b %y") # %b is abbreviated month, %y is 2 digit year

  • Changes the default colour scale to a different palette (only shown for illustration)
  • Changes the y position scale to log10. (only shown for illustration)
  • Changes the x position scale with different label formats

Color Palettes (A digression)

Color Palettes (A digression)

Beware of Color Blindness (A digression)

Color Scales

Green Blindness

Beware of Color Blindness (A digression)

Color Scales

Red Blindness

Beware of Color Blindness (A digression)

Color Scales

Blue Blindness

Beware of Color Blindness (A digression)

Color Scales

Desaturated

Build it by layer

Code
AQI_tbl %>%
    ggplot() +
    geom_point(aes(x=TIME, y=AQI, color = SITEID)) +
    scale_x_datetime(date_labels = "%b %y")+
    geom_hline(yintercept = 100) +
    geom_hline(yintercept = 150) +
    geom_hline(yintercept = 200) +
    geom_hline(yintercept = 300) 

Build it by layer

Code
AQI_tbl %>%
    ggplot() +
    geom_point(aes(x=TIME, y=AQI)) +
    scale_x_datetime(date_labels = "%b %y")+
    geom_hline(yintercept = 100) +
    geom_hline(yintercept = 150) +
     geom_hline(yintercept = 200) +
     geom_hline(yintercept = 300) +
    facet_wrap(~SITEID, nrow =2)

Build it by layer

Code
AQI_tbl %>%
    ggplot() +
    geom_point(aes(x=TIME, y=AQI)) +
    scale_x_datetime(date_labels = "%b %y")+
    geom_hline(yintercept = 100) +
    geom_hline(yintercept = 150) +
     geom_hline(yintercept = 200) +
     geom_hline(yintercept = 300) +
    facet_wrap(~SITEID) +
    xlab("") + ylab("AQI")

Experiment with different geoms

Code
AQI_tbl %>%
    ggplot() +
    geom_bar(aes(x=TIME, y=AQI), stat = "identity") +
    scale_x_datetime(date_labels = "%b %y")+
    geom_hline(yintercept = 100) +
    geom_hline(yintercept = 150) +
     geom_hline(yintercept = 200) +
     geom_hline(yintercept = 300) +
    facet_wrap(~SITEID, nrow =2) +
    xlab("") + ylab("AQI")

Experiment with different geoms

Code
AQI_tbl %>%
    ggplot() +
    geom_smooth(aes(x=TIME, y=AQI, color = SITEID), method = loess, se = FALSE) +
    scale_x_datetime(date_labels = "%b %y")+
    xlab("") + ylab("AQI")
  • Should the focus be on the average trend?

Or should it be on the outliers?

Code
AQI_tbl %>%
    mutate(week_date = week(TIME)) %>%
    group_by(SITEID, week_date) %>%
    mutate(outlier_yn = rstatix::is_outlier(AQI))%>%
    ungroup()%>%
    filter(SITEID == 203) %>%
    ggplot()+
    geom_smooth(aes(x=TIME, y=AQI), method = loess, se = FALSE) +
    geom_point(aes(x=TIME, y=AQI, color = outlier_yn), size = .5)+
    scale_color_manual(values=c('gray', 'red'), guide = FALSE) +
    labs(title = "SiteID 203")

Experiment with different mappings

Code
AQI_tbl %>%
    filter(SITEID == "203") %>%
    ggplot() +
    geom_bar(aes(x=month_of_obs, fill=GRADE), 
             stat = "count", position = "dodge") +
    scale_fill_viridis_d()+
    xlab("") + ylab("Count")

Experiment with position

Code
AQI_tbl %>%
    filter(SITEID == "203") %>%
    ggplot() +
    geom_bar(aes(x=month_of_obs, fill=GRADE), 
             position = "identity", stat = "count") +
    scale_fill_brewer(palette = "Set2")+
    xlab("") + ylab("Count")

Experiment with different mappings

Code
AQI_tbl %>%
    filter(SITEID == "203") %>%
    ggplot() +
    geom_point(aes(x=month_of_obs, shape=GRADE), 
             stat = "count") +
    xlab("") + ylab("Count")

Why is this a bad visualisation? (Hint: Gestalt principles)

Gestalt Principles (A digression)

::: {style=“font-size: .5em} Source: https://dataspire.org/blog/leveraging-perception-science-to-our-advantage :::

Make it easy for the viewer

Code
p <- AQI_tbl %>%
    filter(SITEID == "203") %>%
    group_by(month_of_obs, GRADE) %>%
    summarize(num_obs = n()) %>%
    ggplot() +
    geom_point(aes(x=month_of_obs, 
                  y=num_obs,
                  shape = GRADE))+
    geom_line(aes(x=month_of_obs, 
                  y=num_obs, 
                  group=GRADE))+
    xlab("") + ylab("Count")
p

I hate legends

Code
p + 
 annotate('text', x = "Nov", y = 400, label = 'Grade 2', fontface = 'bold') +
 annotate('text', x = "Sep", y = 100, label = 'Grade 3', fontface = 'bold') +
 scale_shape(guide = "none")

Take advantage of background and foreground

Code
AQI_tbl %>%
    filter(SITEID == "203") %>%
    group_by(month_of_obs, GRADE) %>%
    summarize(num_obs = n()) %>%
    ggplot() +
    geom_point(aes(x=month_of_obs, 
                  y=num_obs,
                  shape = GRADE,
                  alpha = GRADE))+
    geom_line(aes(x=month_of_obs, 
                  y=num_obs, 
                  group=GRADE,
                  alpha=GRADE))+
    scale_alpha_manual(values = c(.2,.2,1,1,.2,.2,.2), guide = "none")+
    scale_shape(guide = "none")+
    xlab("") + ylab("Count") +
     annotate('text', x = "Nov", y = 400, label = 'Grade 2', fontface = 'bold') +
    annotate('text', x = "Sep", y = 100, label = 'Grade 3', fontface = 'bold') 

Advanced techniques

Mix facets and filters

Code
AQI_tbl %>%
    filter(GRADE %in% c("2", "3")) %>%
    group_by(SITEID,month_of_obs, GRADE) %>%
    summarize(num_obs = n()) %>%
    ggplot() +
    geom_point(aes(x=month_of_obs, 
                  y=num_obs,
                  shape = GRADE))+
    geom_line(aes(x=month_of_obs, 
                  y=num_obs, 
                  group=GRADE))+
    facet_wrap(~SITEID)+
    scale_shape(guide = "none")+
    xlab("") + ylab("Count")

Collapse factors (A better option)

Code
AQI_tbl %>%
    filter(GRADE != "/") %>%
    mutate(
        GRADE_gen = fct_collapse(GRADE,
        "OK" = c("1", "2"),
        "Bad" = c("3", "4", "5", "6")
    ))%>%
    group_by(SITEID,month_of_obs, GRADE_gen) %>%
    summarize(num_obs = n()) %>%
    ggplot() +
    geom_point(aes(x=month_of_obs, 
                  y=num_obs,
                  shape = GRADE_gen))+
    geom_line(aes(x=month_of_obs, 
                  y=num_obs, 
                  group=GRADE_gen))+
    facet_wrap(~SITEID)+
    scale_shape(name = "# obvs. with air quality")+
    theme(legend.position = "bottom")+
    xlab("") + ylab("Count")

More groupings are not always better

Code
AQI_tbl %>%
    filter(GRADE != "/") %>%
    mutate(
        GRADE_gen = fct_collapse(GRADE,
        "OK" = c("1", "2"),
        "Bad" = c("3", "4", "5", "6")
    ))%>%
    group_by(SITEID,time_of_day, month_of_obs, GRADE_gen) %>%
    summarize(num_obs = n()) %>%
    ggplot() +
    geom_point(aes(x=month_of_obs, 
                  y=num_obs,
                  shape = GRADE_gen))+
    geom_line(aes(x=month_of_obs, 
                  y=num_obs, 
                  group=GRADE_gen))+
    facet_grid(time_of_day~SITEID)+
    scale_shape(name = "# obvs. with air quality")+
    theme(legend.position = "bottom")+
    xlab("") + ylab("Count")

Better font support with showtext

Code
library(showtext)
showtext_auto()

AQI_tbl %>%
    filter(SITEID == "203") %>%
    ggplot() +
    geom_bar(aes(x=month_of_obs, fill=AIRQUALITY), 
             stat = "count", position = "dodge") +
    scale_fill_brewer(palette = "Set2")+
    xlab("") + ylab("# of obvs.")

Do individual observations matter?

Maybe focus on worst observation per day.

Data processing code
AQI_tbl_summary <- AQI_tbl %>% 
  mutate(time_date = date(TIME))%>%
  group_by(SITEID, time_date, month_of_obs, season) %>%
  summarise(max_AQI_day = max(AQI, na.rm=T)) %>%
  ungroup() %>%
  mutate(bad_airq_day = ifelse(max_AQI_day>100, 1, NA)) %>%
  group_by(SITEID, season) %>%
  summarise(num_bad_airq_days = sum(bad_airq_day, na.rm=T))
ggplot code
AQI_tbl_summary %>%
    ggplot() +
    geom_bar(aes(x=reorder(SITEID, desc(num_bad_airq_days)), 
                 y=num_bad_airq_days), 
             stat = "identity", na.rm=T) +
    xlab("SITEID") + 
    ylab("# Bad Air Quality Days")

Focus on distributions

Code
AQI_tbl %>%
    ggplot() +
    geom_violin(aes(x=month_of_obs, y=AQI)) +
    facet_wrap(~ SITEID)+
    xlab("") 

Focus on what is really important!

Code
median_IQR <- function(x) {
  data.frame(y = median(x), # Median
             ymin = quantile(x)[2], # 1st quartile
             ymax = quantile(x)[4])  # 3rd quartile
}

 AQI_tbl %>%
    ggplot() +
    stat_summary(aes(x=month_of_obs, y=AQI), 
                 fun.data = median_IQR,
                 geom = "linerange") +
    facet_wrap(~ SITEID)+
    xlab("") 

Is the theme getting in the way?

Code
library(ggthemes)
 AQI_tbl %>%
    ggplot(aes(x=month_of_obs, y=AQI)) +
    stat_summary(fun.data = "median_IQR",
                 geom = "linerange"
                 ) +
         stat_summary(fun.y = "median",
                 geom = "point",
                 color = 'red'
                 ) +
     facet_wrap(~ SITEID)+
     xlab("")+
    theme_tufte()

More facets are not awalys better

Code
library(ggthemes)
 AQI_tbl %>%
    ggplot(aes(x=month_of_obs, y=AQI)) +
    stat_summary(fun.data = "median_IQR",
                 geom = "linerange"
                 ) +
         stat_summary(fun = "median",
                 geom = "point",
                 color = 'red'
                 ) +
     facet_grid(time_of_day ~ . )+
     xlab("")+
    theme_tufte()

What about a spatial visualisation?

Data processing code
stations_tbl <- here("data", "raw", "Station.csv") %>%
            read_csv(locale = locale(encoding = "GBK")) %>%
            mutate(SITEID = as.character(SITEID))


AQI_summary_tbl <- AQI_tbl %>%
    group_by(month_of_obs, SITEID,) %>%
    summarise(median_AQI = median(AQI, na.rm=T)) %>%
    right_join(stations_tbl, by="SITEID")
Visualisation code
AQI_summary_tbl %>%
    ggplot()+
    geom_point(aes(x=LON, y=LAT, size = median_AQI))+
    facet_wrap(~month_of_obs)+
    scale_x_continuous(expand = expansion(mult = .2))+
    scale_y_continuous(expand = expansion(mult = .2))+
    scale_size(name = "Median AQI")

Context matters

Code
library(sf)
library(tmap)

tmap_mode("view")

AQI_summary_tbl %>%
    filter(month_of_obs %in% c('Jul', 'Jan')) %>%
    sf::st_as_sf(coords = c("LON", "LAT"), crs = 4326) %>%
    tm_shape() +
    tm_dots(size = "median_AQI") +
    tm_facets(by = "month_of_obs", ncol=2) +
    tm_basemap("OpenStreetMap.Mapnik")

Patch ’em up!

Code
library(patchwork)
library(ggmap)

p1 <- AQI_tbl %>%
    ggplot() +
    geom_smooth(aes(x=TIME, y=AQI, color = SITEID), method = loess, se = FALSE) +
    scale_x_datetime(date_labels = "%b %y")+
    xlab("") + ylab("AQI") +
    scale_color_discrete(guide = "none")

bbox = c(left = min(stations_tbl$LON), bottom = min(stations_tbl$LAT), right = max(stations_tbl$LON), top = max(stations_tbl$LAT))
p = get_map(bbox, zoom=10, source = "stamen", maptype = "toner-background")


p2 <- ggmap(p)+
      geom_point(aes(x=LON, y=LAT), size =2, col = 'red', data = stations_tbl)
      

p1|p2

Further Work

  • Visualise the changes in AQI based on distance to city centre
  • Instead of visualising stations and their readings, spatially extrapolate the readings
  • How does changing coord_cartesian to coord_polar affect the visualisations
  • Notice that most of the monthly summary visualisations start with Jan. but daily’s start with Jul. Why? Reorder the monthly visuals to start with Jul.
  • Experiment with different basemaps in tmap (only works for “view” mode)
  • Experiment with different styling for tm_shape

Thank you!