Spatial Data in R
5/4/23
Conceptual rethink
Visualising spatial data
Code
library(ggplot2)
library(ggthemes)
numtrips <- sm_tbl %>%
filter(station_name_O != station_name_D) %>%
mutate(hr = hour(dat_time_O),
time_of_day = hr %>% cut(breaks=c(0,6,10,16,20,24), include.lowest = TRUE, labels=c("Midnight - 6AM", "6AM - 10AM", "10AM - 4PM", "4PM - 8PM", "8PM - Midnight"))
) %>%
group_by(station_name_O, station_name_D, time_of_day) %>%
summarise(lon_O = first(lon_O),
lat_O = first(lat_O),
lon_D = first(lon_D),
lat_D = first(lat_D),
totaltrips = n()
)
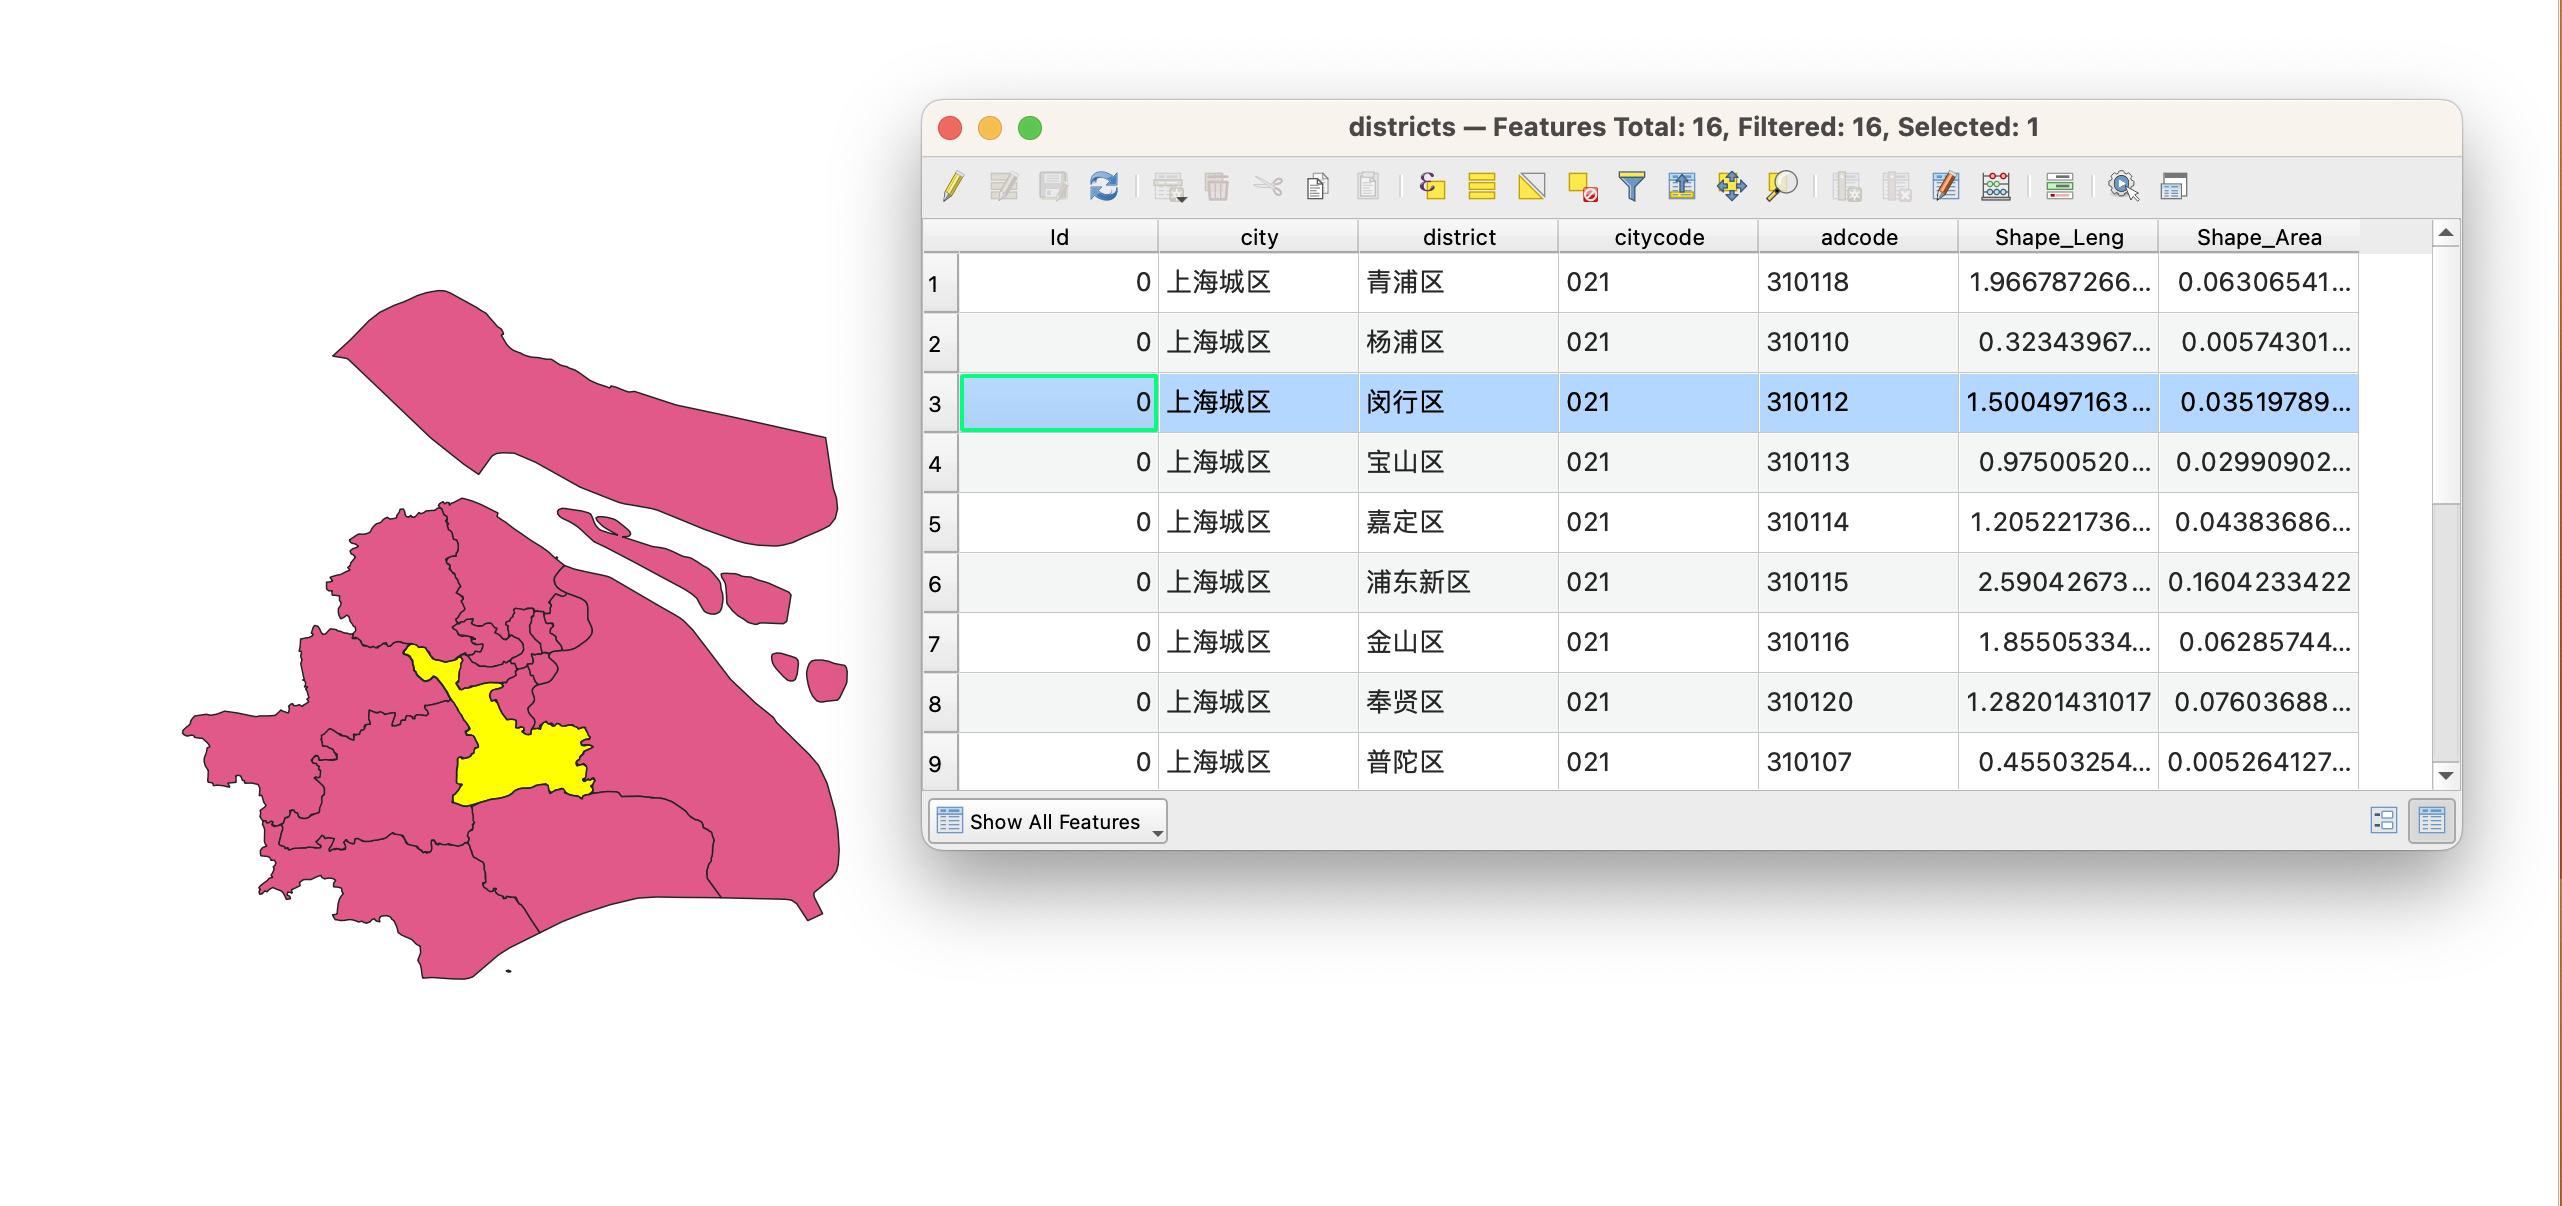
numtrips %>%
ggplot()+
geom_segment(aes(x=lon_O, y=lat_O,xend=lon_D, yend=lat_D, alpha=totaltrips))+
#Here is the magic bit that sets line transparency - essential to make the plot readable
scale_alpha_continuous(range = c(0.005, 0.01), guide='none')+
facet_wrap(time_of_day~.)+
#Set black background, ditch axes
scale_x_continuous("", breaks=NULL)+
scale_y_continuous("", breaks=NULL) +
theme_tufte()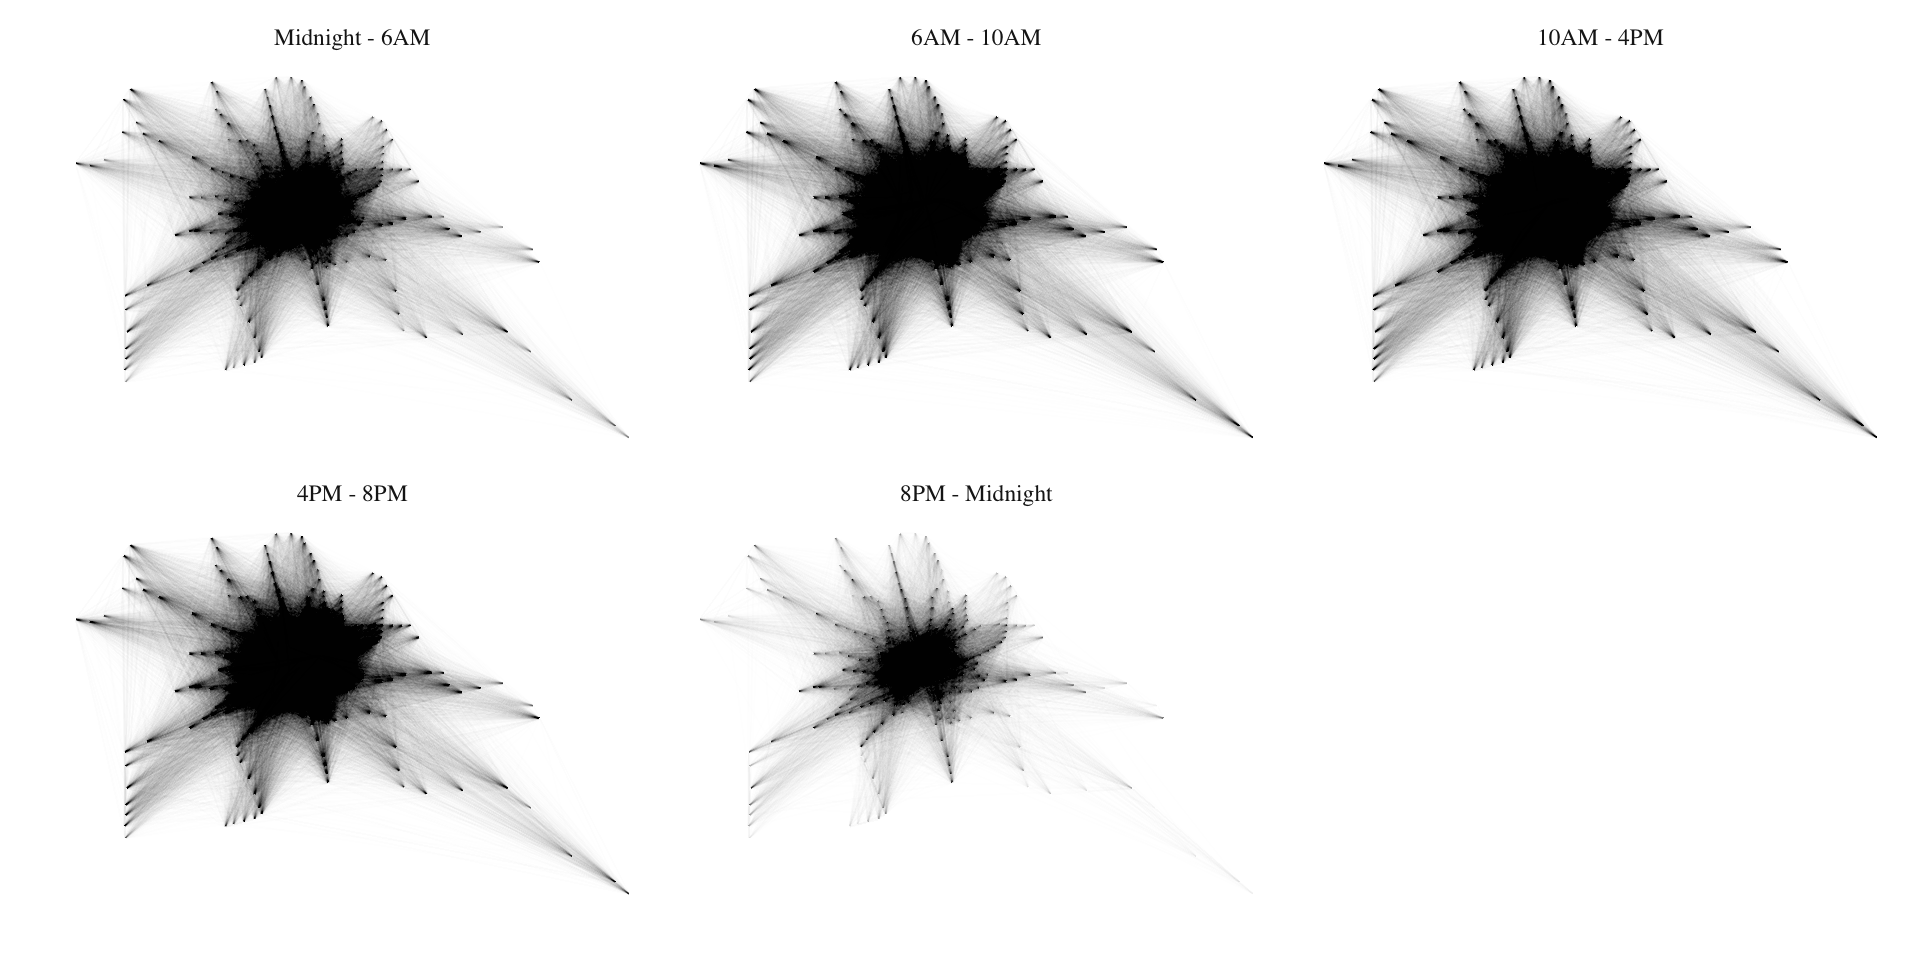
Visualising spatial data
Code
numtrips <- sm_tbl %>%
    filter(station_name_O != station_name_D) %>%
  mutate(hr = hour(dat_time_O),
         time_of_day = hr %>% cut(breaks=c(0,6,10,16,20,24), include.lowest = TRUE, labels=c("Midnight - 6AM", "6AM - 10AM", "10AM - 4PM", "4PM - 8PM", "8PM - Midnight"))
         ) %>%
  group_by(station_name_D, time_of_day) %>%
  summarise(lon_D = first(lon_D),
            lat_D = first(lat_D),
            totaltrips = n()
            )


numtrips %>%
 ggplot()+
  geom_point(aes(x=lon_D, y=lat_D, size=totaltrips))+
  scale_size_continuous(range = c(0.01, 2), guide='none')+
  facet_wrap(time_of_day~.)+
  #Set black background, ditch axes
  scale_x_continuous("", breaks=NULL)+
  scale_y_continuous("", breaks=NULL) +
    theme_tufte()+
    labs(main = "Popularity of destination stations on Apr 1, 2015")
But basemaps provide context
Code
library(ggmap)

bbox <- c(left = 120.9892, bottom = 30.7151, right = 122.0228, top = 31.4177)
g1 <- get_stamenmap(bbox, zoom = 10, maptype = "toner-hybrid", color = "bw")


ggmap(g1)+
    geom_point(aes(x=lon_D, y=lat_D, size=totaltrips), data = numtrips)+
  scale_size_continuous(range = c(0.01, 2), guide='none', trans = )+
  facet_wrap(time_of_day~.)+
  #Set black background, ditch axes
  scale_x_continuous("", breaks=NULL)+
  scale_y_continuous("", breaks=NULL) +
    theme_tufte()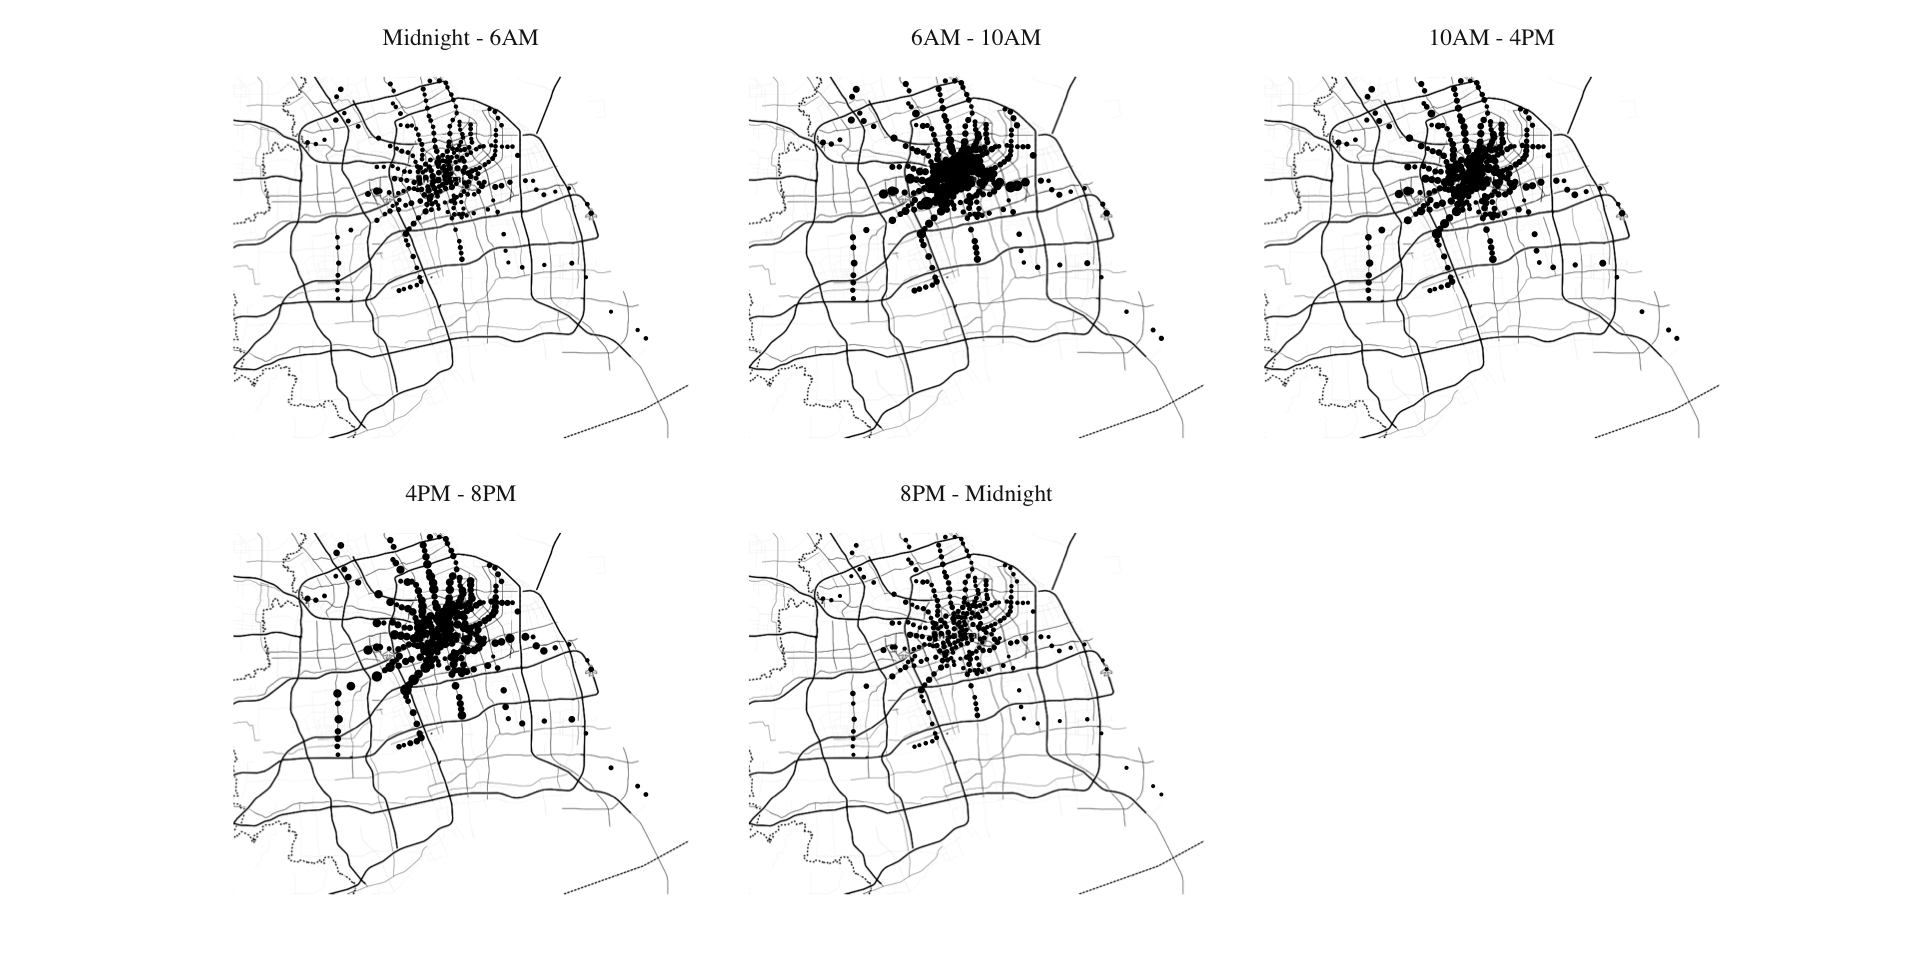
Spatial with sf

sf ecosystem
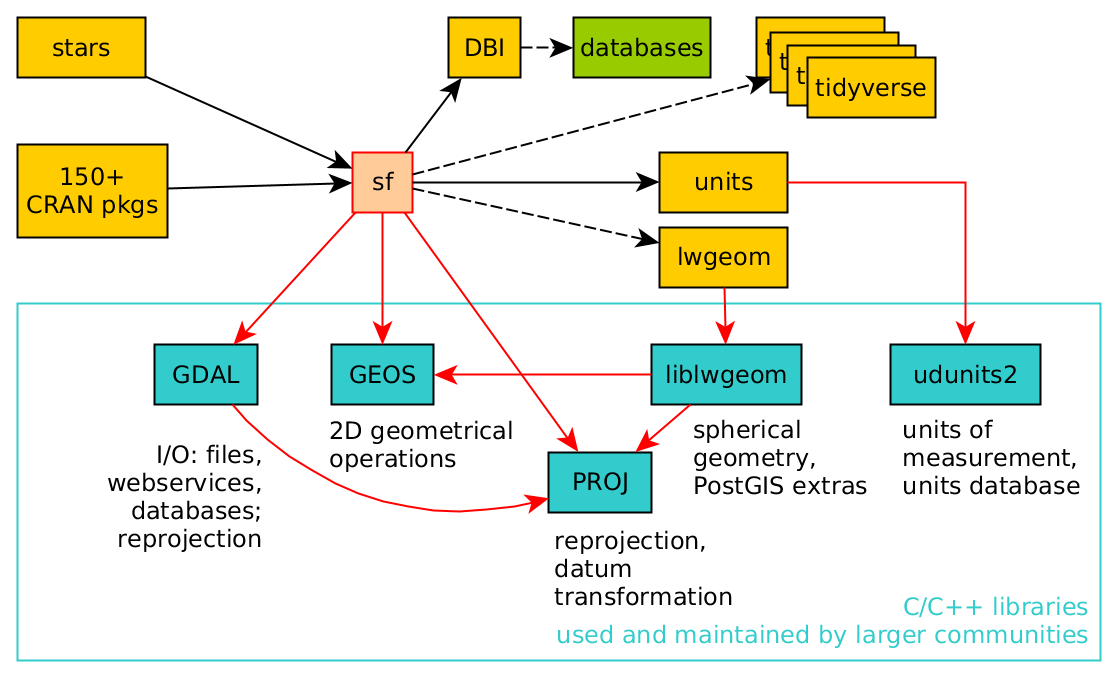
sf: Objects with simple features
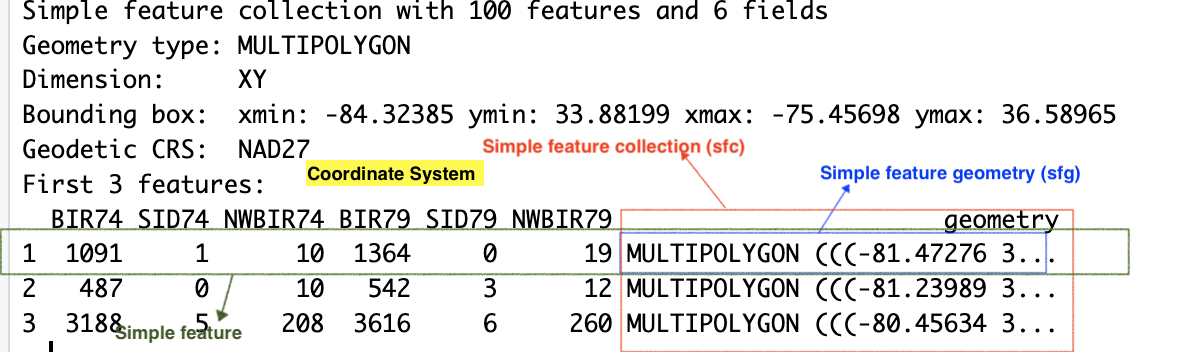
Geometry
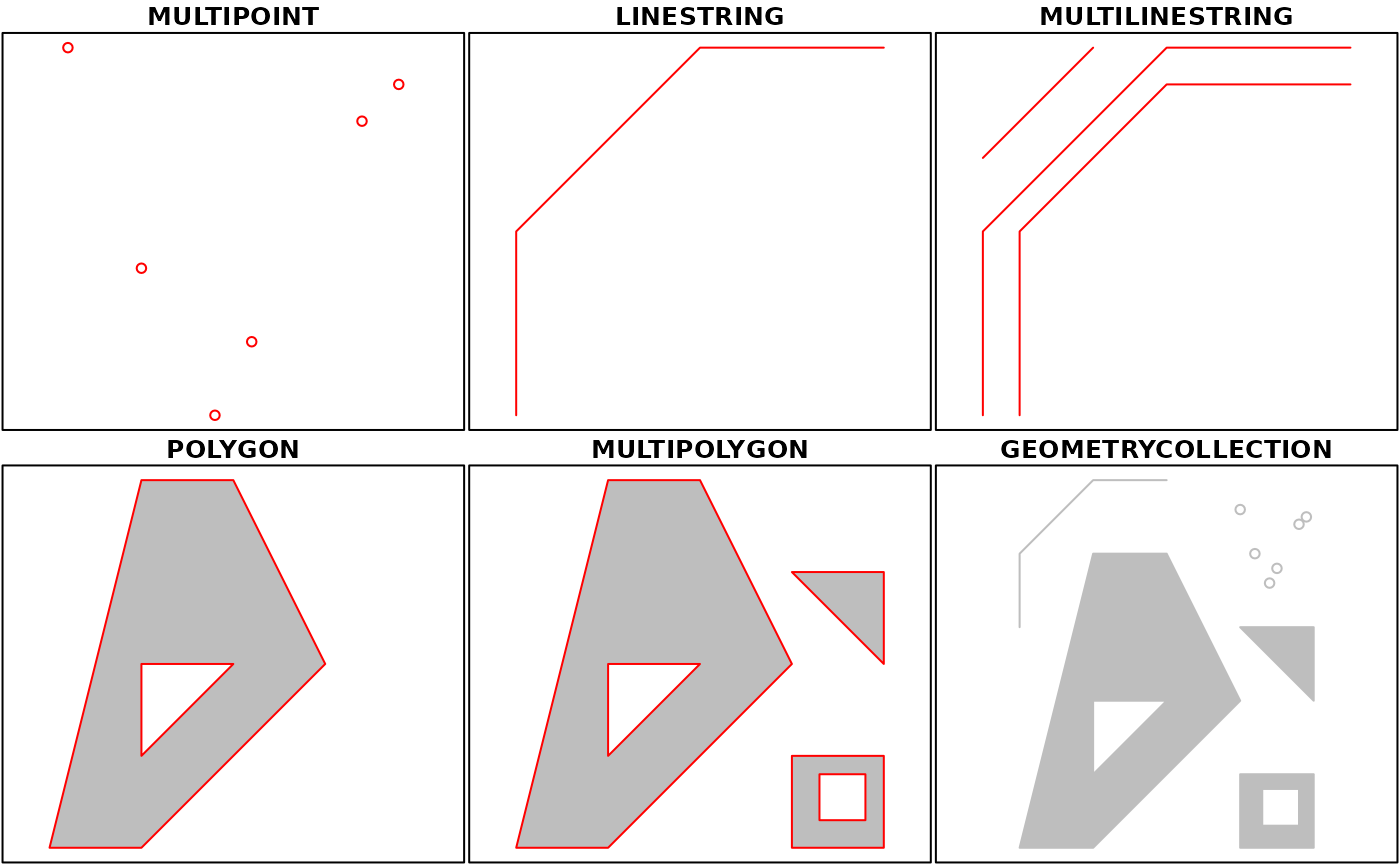
Polygons are complex (A digression)

Geometry is not that different from time
tmap again
Code
tmap_mode("plot")

numtrips <- sm_tbl %>%
    filter(station_name_O != station_name_D) %>%
  mutate(hr = hour(dat_time_O),
         time_of_day = hr %>% cut(breaks=c(0,6,10,16,20,24), include.lowest = TRUE, labels=c("Midnight - 6AM", "6AM - 10AM", "10AM - 4PM", "4PM - 8PM", "8PM - Midnight"))
         ) %>%
  group_by(station_name_D, time_of_day) %>%
  summarise(lon_D = first(lon_D),
            lat_D = first(lat_D),
            totaltrips = n()
            ) %>%
    st_as_sf(coords = c("lon_D", "lat_D"), crs=4326)


numtrips %>%
    tm_shape()+
    tm_bubbles(size = "totaltrips",
            col="red",
            border.col = "red",
            title.size = "# of trips",
            legend.size.is.portrait = TRUE
            )+
    tm_facets(by = "time_of_day") +
     tm_layout(
            legend.outside.size = 0.2,
            main.title= 'Popularity of trip destination',
            main.title.position = c("center", 'top'))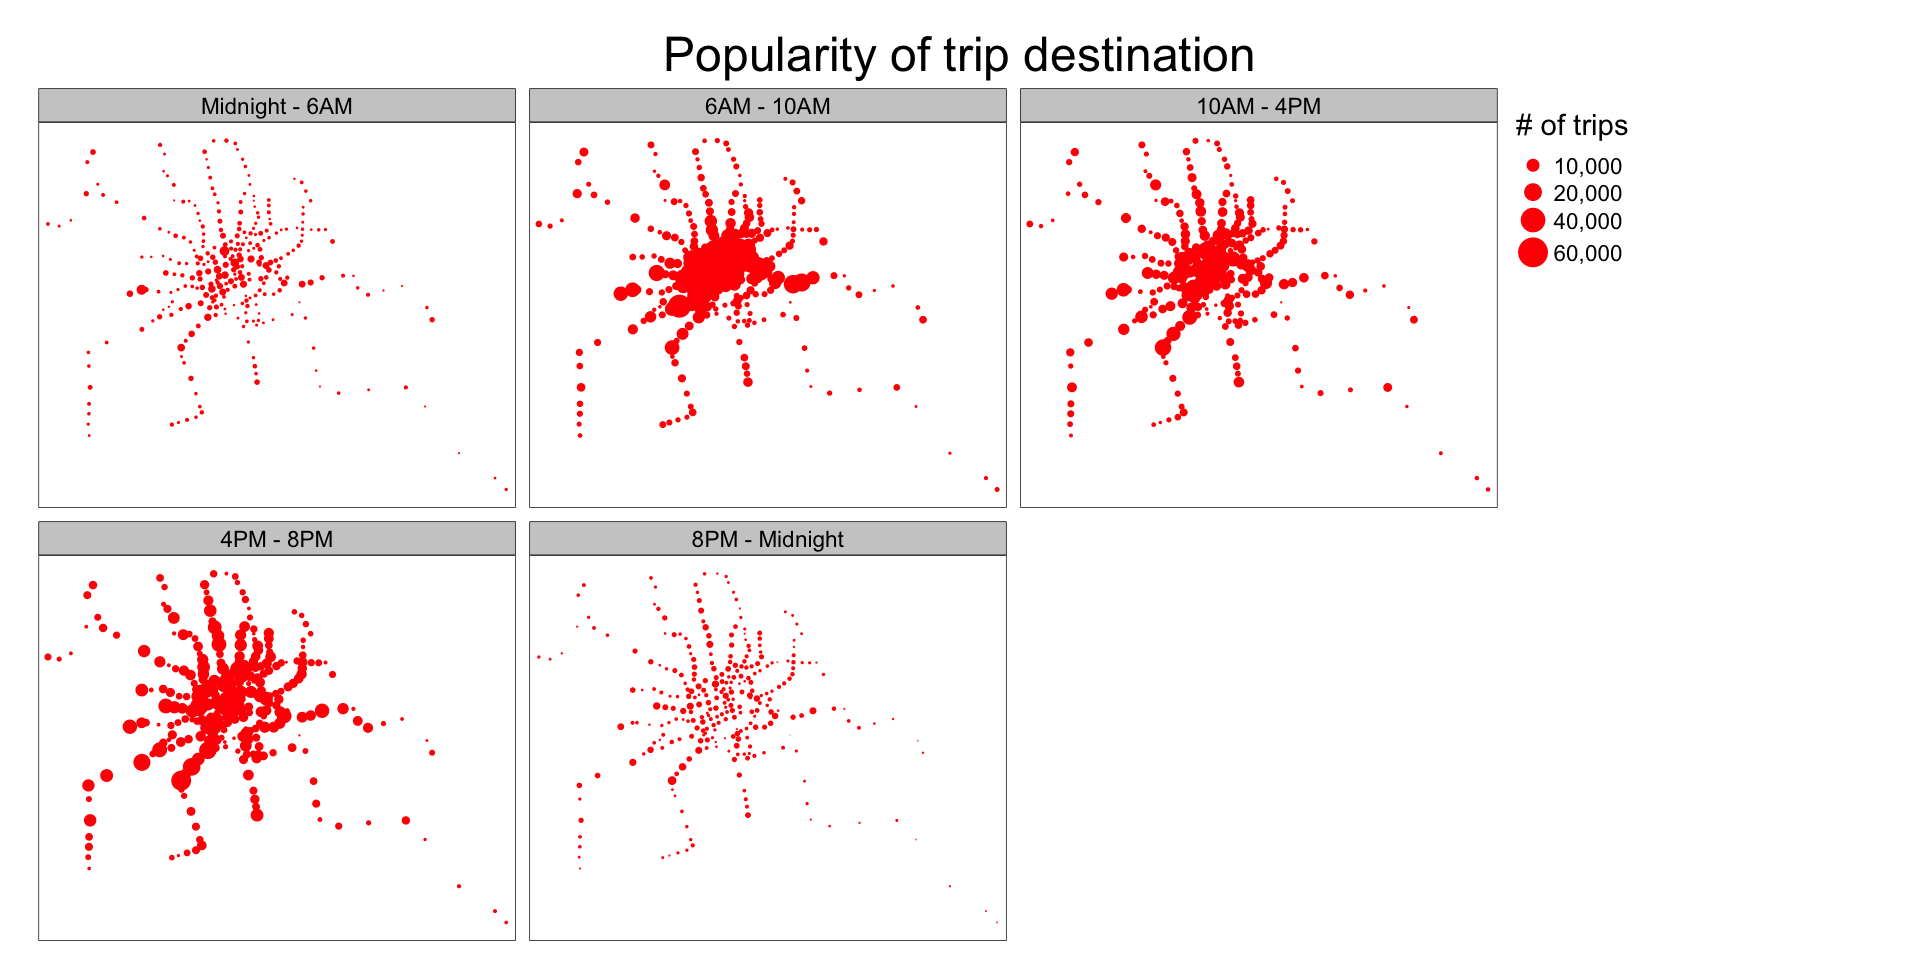
Visualise it
Reading in external spatial objects
 ….. and many more